> ## Documentation Index
> Fetch the complete documentation index at: https://moengage-user-guide.mintlify.site/llms.txt
> Use this file to discover all available pages before exploring further.
# Why does the behavior analysis show the In-App shown event after delivery, but the campaign performance chart doesn't?
## Problem
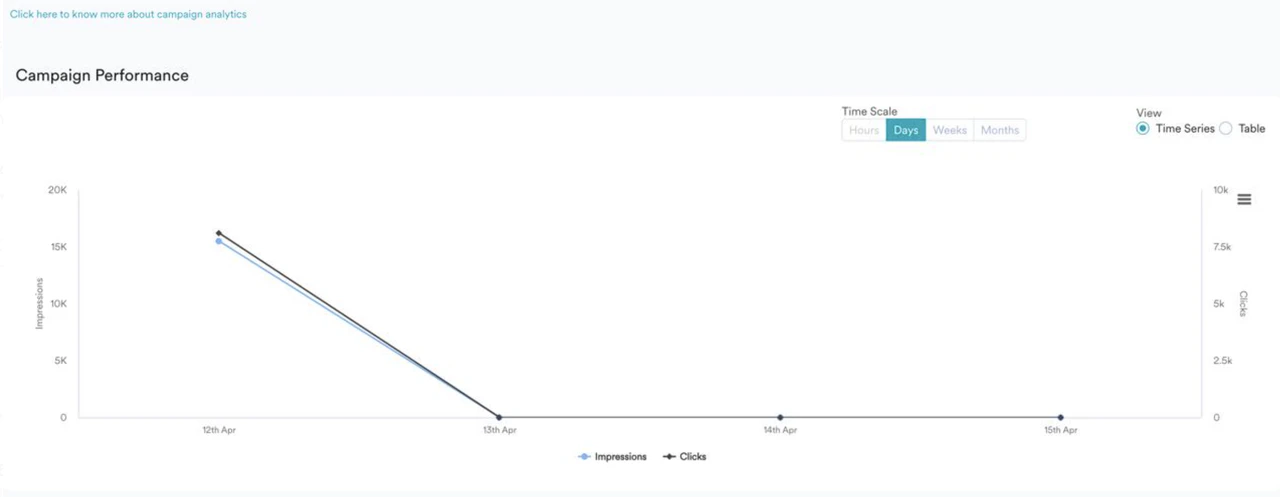
* The behavior analysis for an In-app Messaging campaign set to deliver on a particular day displays the In-app shown event for days after delivery. 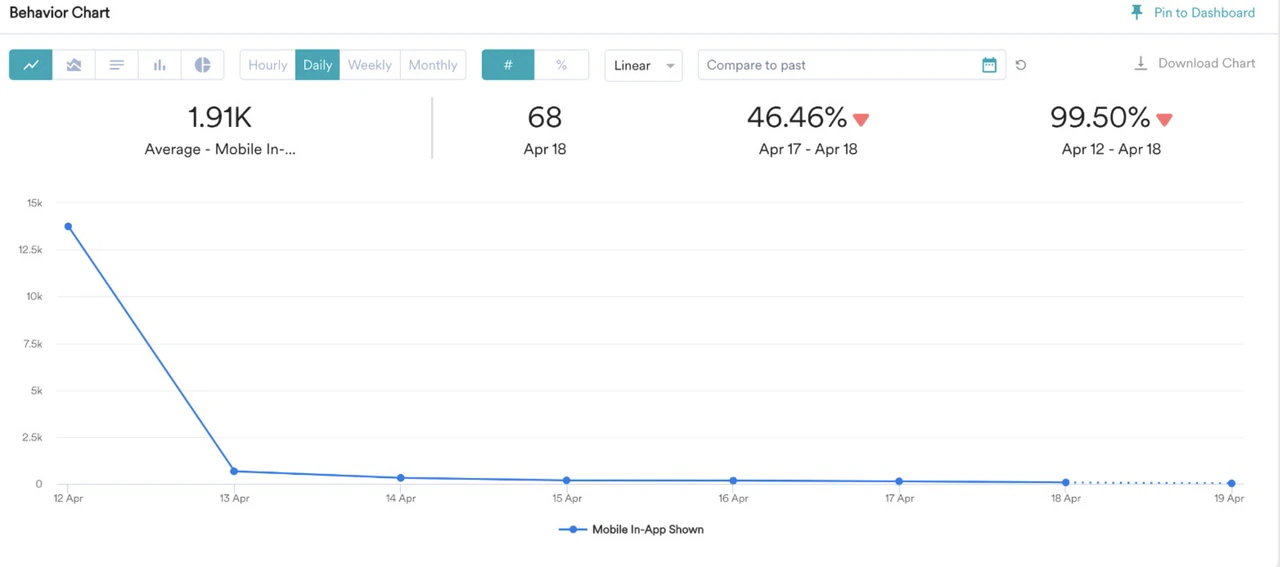 * However, the Campaign Performance chart in the campaign shows only impressions on the delivery date.
  ## Explanation
This discrepancy is due to the difference in time considered for Campaign Impressions and the Analyze Module.
* Campaign Impressions are based on *Event Time*.
* Data in Analytics and Segmentation is based on *Event Received Time* (server time).
See the following image for reference:
## Explanation
This discrepancy is due to the difference in time considered for Campaign Impressions and the Analyze Module.
* Campaign Impressions are based on *Event Time*.
* Data in Analytics and Segmentation is based on *Event Received Time* (server time).
See the following image for reference:  You can verify this by checking the **Event Time** and **Event Received Time** on the User profile. For more information, refer to [Event Time and Received Time](/user-guide/data/event-data/event-time-and-received-time).