- Acquisition - gives you the data for all new users that you acquired through different platforms(web, Android, and iOS) and sources(any third-party advertisement sources).
- Engagement - gives you the data of your active users and their sessions on your app or website.
- Conversion - gives you the data of the user conversion rates and the revenue generated.
- Retention - gives you the data on the retention rates of your users and the RFM segments to which they belong.
Click the Switch to new option to view the new Key Metrics dashboard.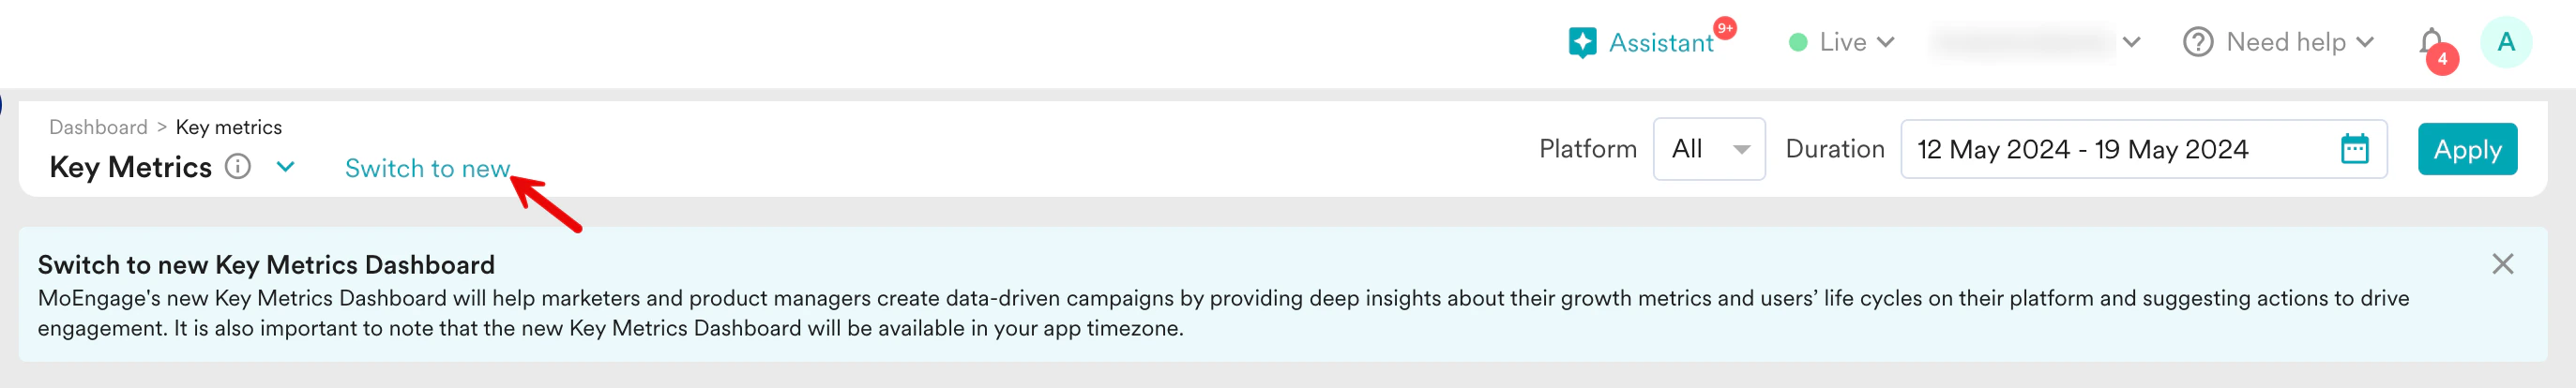
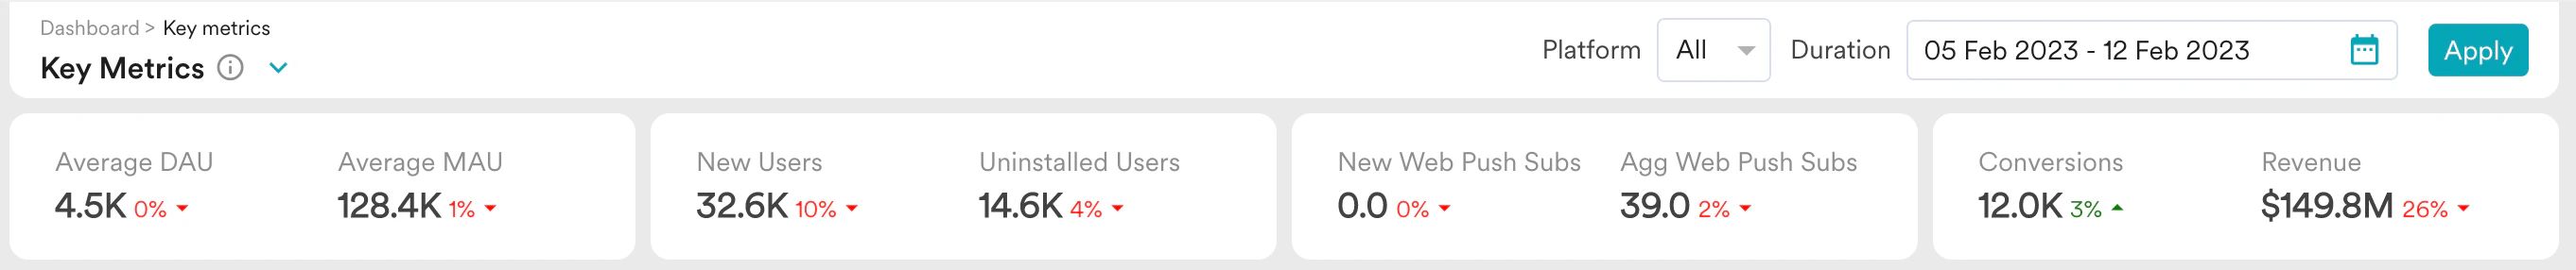
Individual Metrics
Daily Active Users and 30 Day Active Users
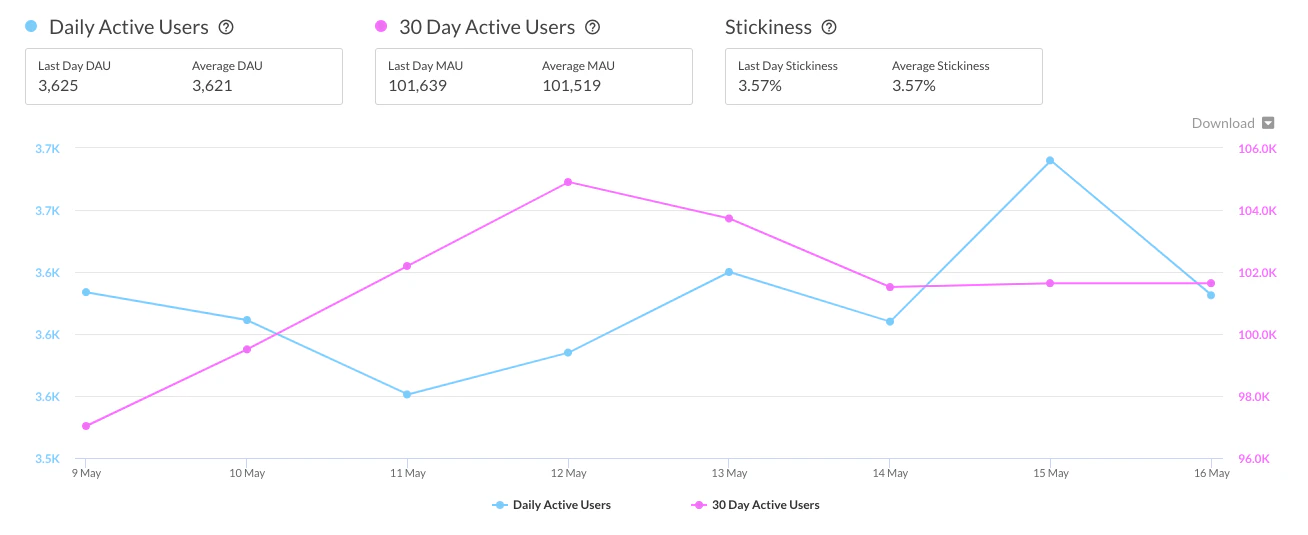
Calculation - Reading count of unique users, who performed App/Site Open event, for a given day. 30 Day Active Users - Number of unique users who opened the app in the last 30 days
Calculation - Reading count of unique users, who performed App/Site Open event, for the last 30 days. Stickiness - The stickiness ratio shows how often users engage with your app/site. The higher the percentage, the better. It means you have more MAUs sticking around long enough to become DAUs.
Calculation - Stickiness can be calculated as the ratio of DAU by MAU(DAU/MAU)
New Users, Installs & Uninstalled Users
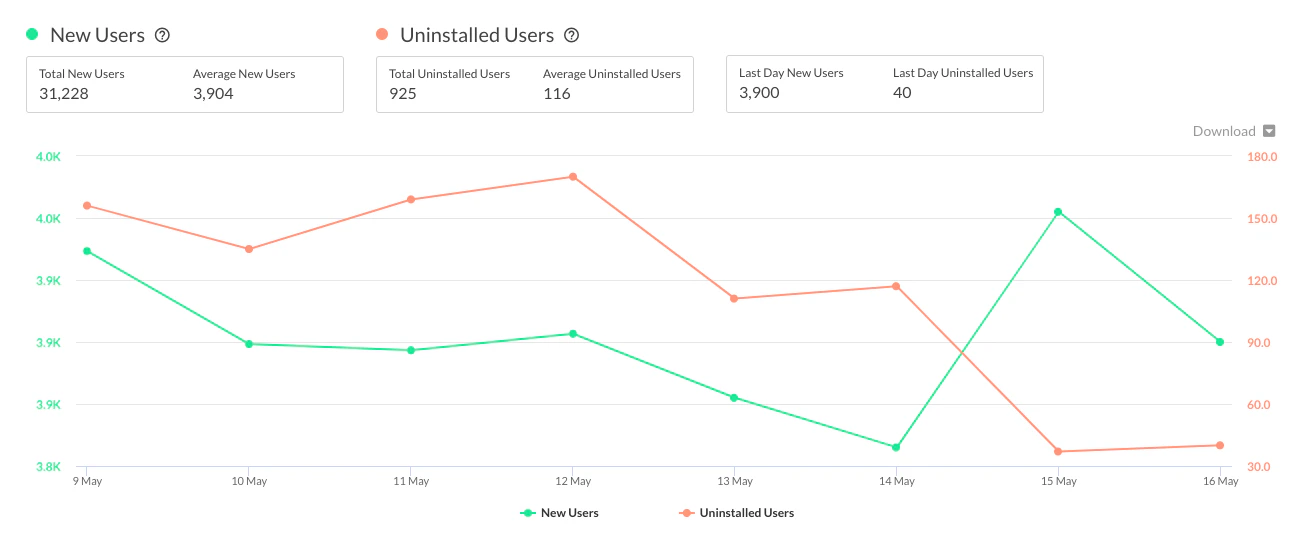
Calculation - New users signed up (First Seen user property is equal to calculation day) that day Uninstalled Users - Number of users who uninstalled on a given day
Calculation - The count of users based on the user attribute ‘uninstalled time’ on the day of calculation and installed status is false. Retention Rate - The Retention Rate shows the percentage of users retained on a given day.
Calculation - It is the ratio of Net Installs(Install - Uninstalls) to the Total Installs on the day
Uninstalled users count in Segmentation is based on the event ‘uninstall’.
New Web Push Subscribers & Aggregate Web Push Subscribers
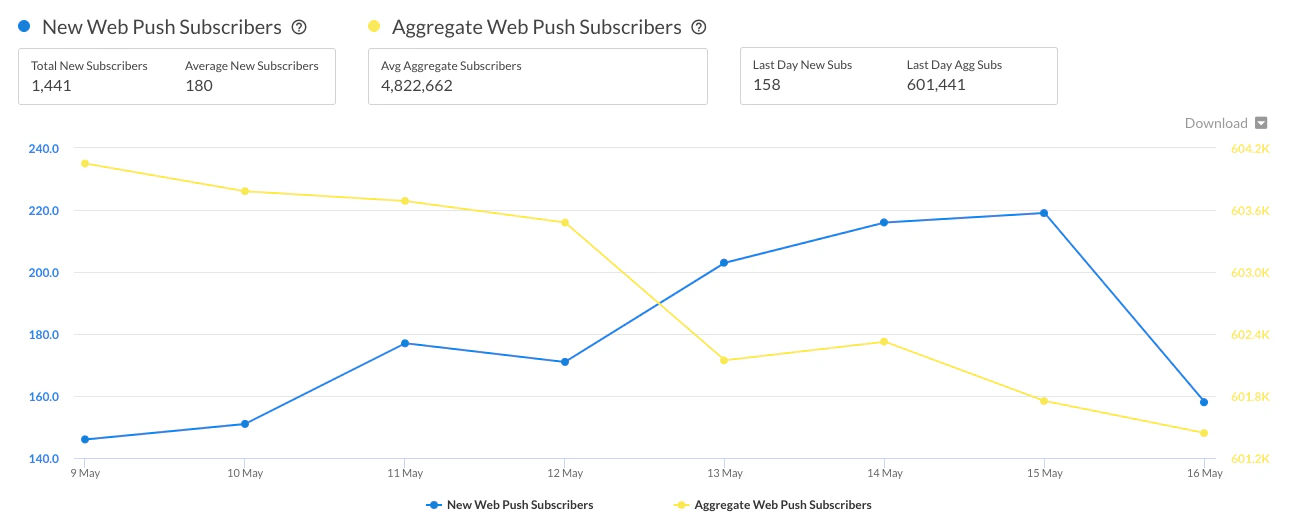
Calculation - Count of unique users, who performed Subscribed to Web Push event for a day Aggregate Web Push Subscribers - Total number of users who are subscribed to web push notifications
Calculation - Count of users with Web Push Subscription Status user property as true and Web Push Subscription Time is less than or equal to calculation day.
Goal Event Unique Count & Total Revenue
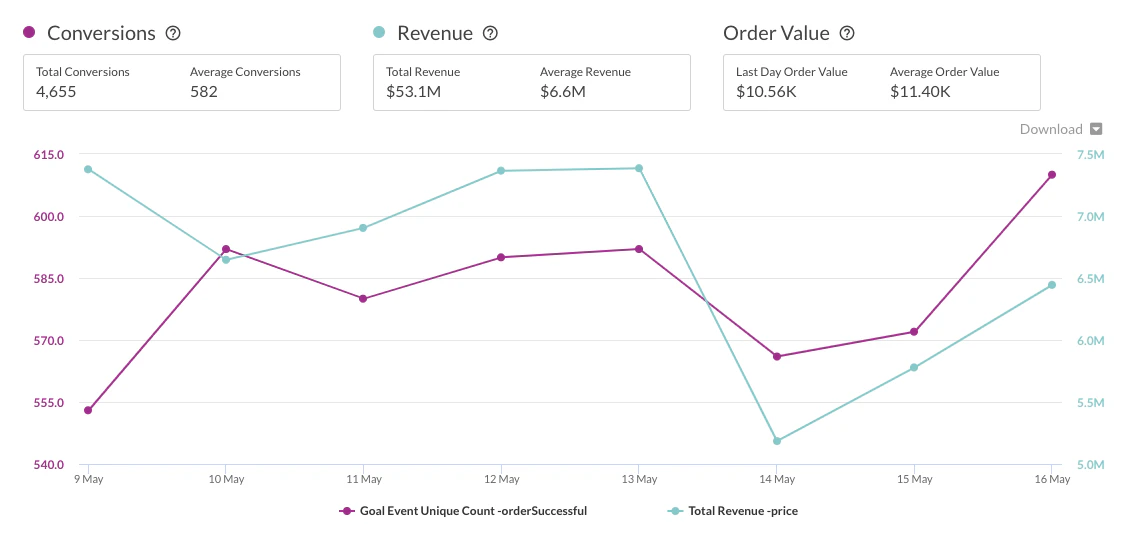
Calculation - Number of unique users who performed the GOAL event on a given day Total Revenue - Total Revenue generated by the users who performed the GOAL event
Calculation - Total sum of revenue attribute in GOAL event for a given day. Order Value Per Converted User - Order value tracks the average amount spent by a user on an app/site. Calculation - To calculate the average order value, divide total revenue by the total number of converted users. This is derived from App Conversion Goal selected under Settings -> App Settings -> Workspace ID, Time-Zone, Key Metrics
Download Chart Data
Data from all of the above charts can be downloaded as an image or a data file in various formats such as CSV, XLS, PNG, JPEG, and pdf. To download, click on the download button at the top right of the charts. To view only one metric in the chart, click on the other metrics on the legend below the chart line. Key Metrics & Segmentation MoE Segmentation provides a real-time calculation of the user and event data. This real-time snapshot of data may or may not match the Key metrics. Data mismatch between key metrics and segmentation is due to:- Key Metrics are the snapshot of data at a specific time. After that time, data may change or update (for example - User got merged, User location updated, OS updated, LTV Increased, and so on), hence the same query on the same data may result in different numbers after some time.
- In a very rare event, data sent by SDK may get some processing delays. In these rare cases, the calculated data may not be correct. MoEngage continuously tracks these anomalies and updates that data into Key Metrics accordingly.