All the metrics are calculated and displayed in the App’s Timezone.
Accessing the Web Personalization Analytics Page
Follow the steps below to access the Experience Analytics page:- On the sidebar menu in MoEngage, hover over the Engage menu item
 . The Engage menu appears.
 - Click + All Campaigns.
 The All campaigns page appears with all the campaigns you’ve created.
 - Click the row that displays the Web Personalization campaign for which you wish to see the analytics information.
The following sections are available on the new screen:
Campaign Details
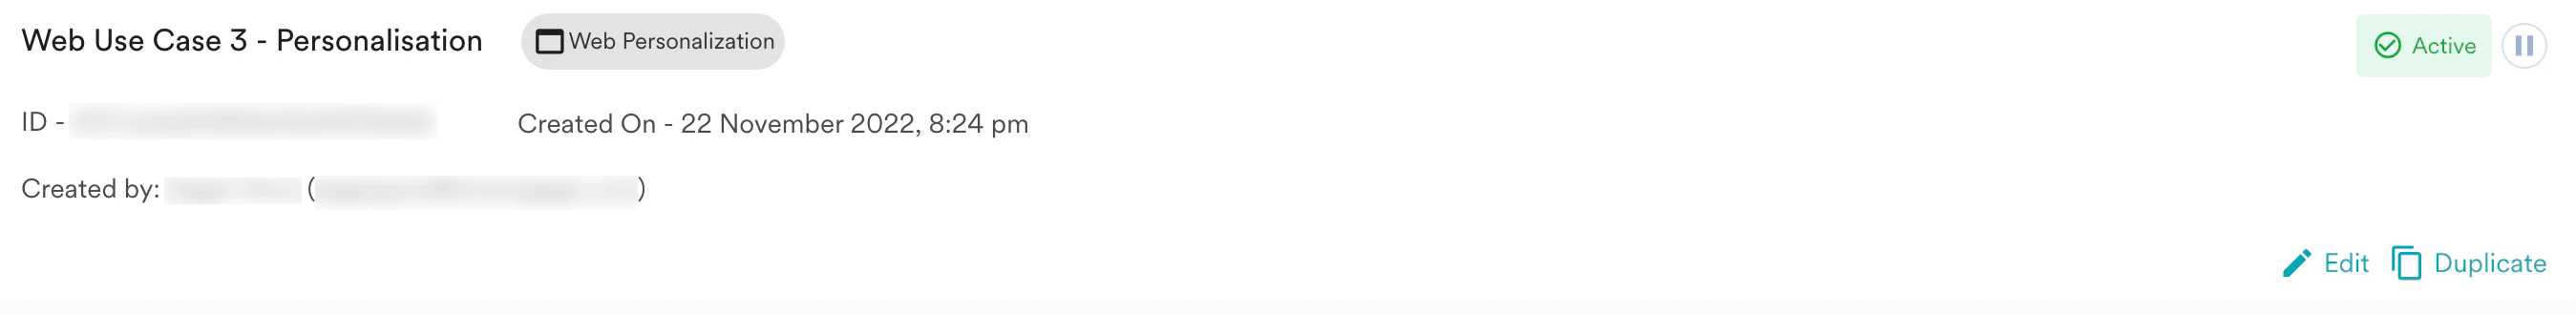
- Campaign name and type
- Campaign ID
- The date and time when the campaign was created
- The user who created the campaign
- Status of the Campaign
- Option to edit/duplicate/pause/play the campaign
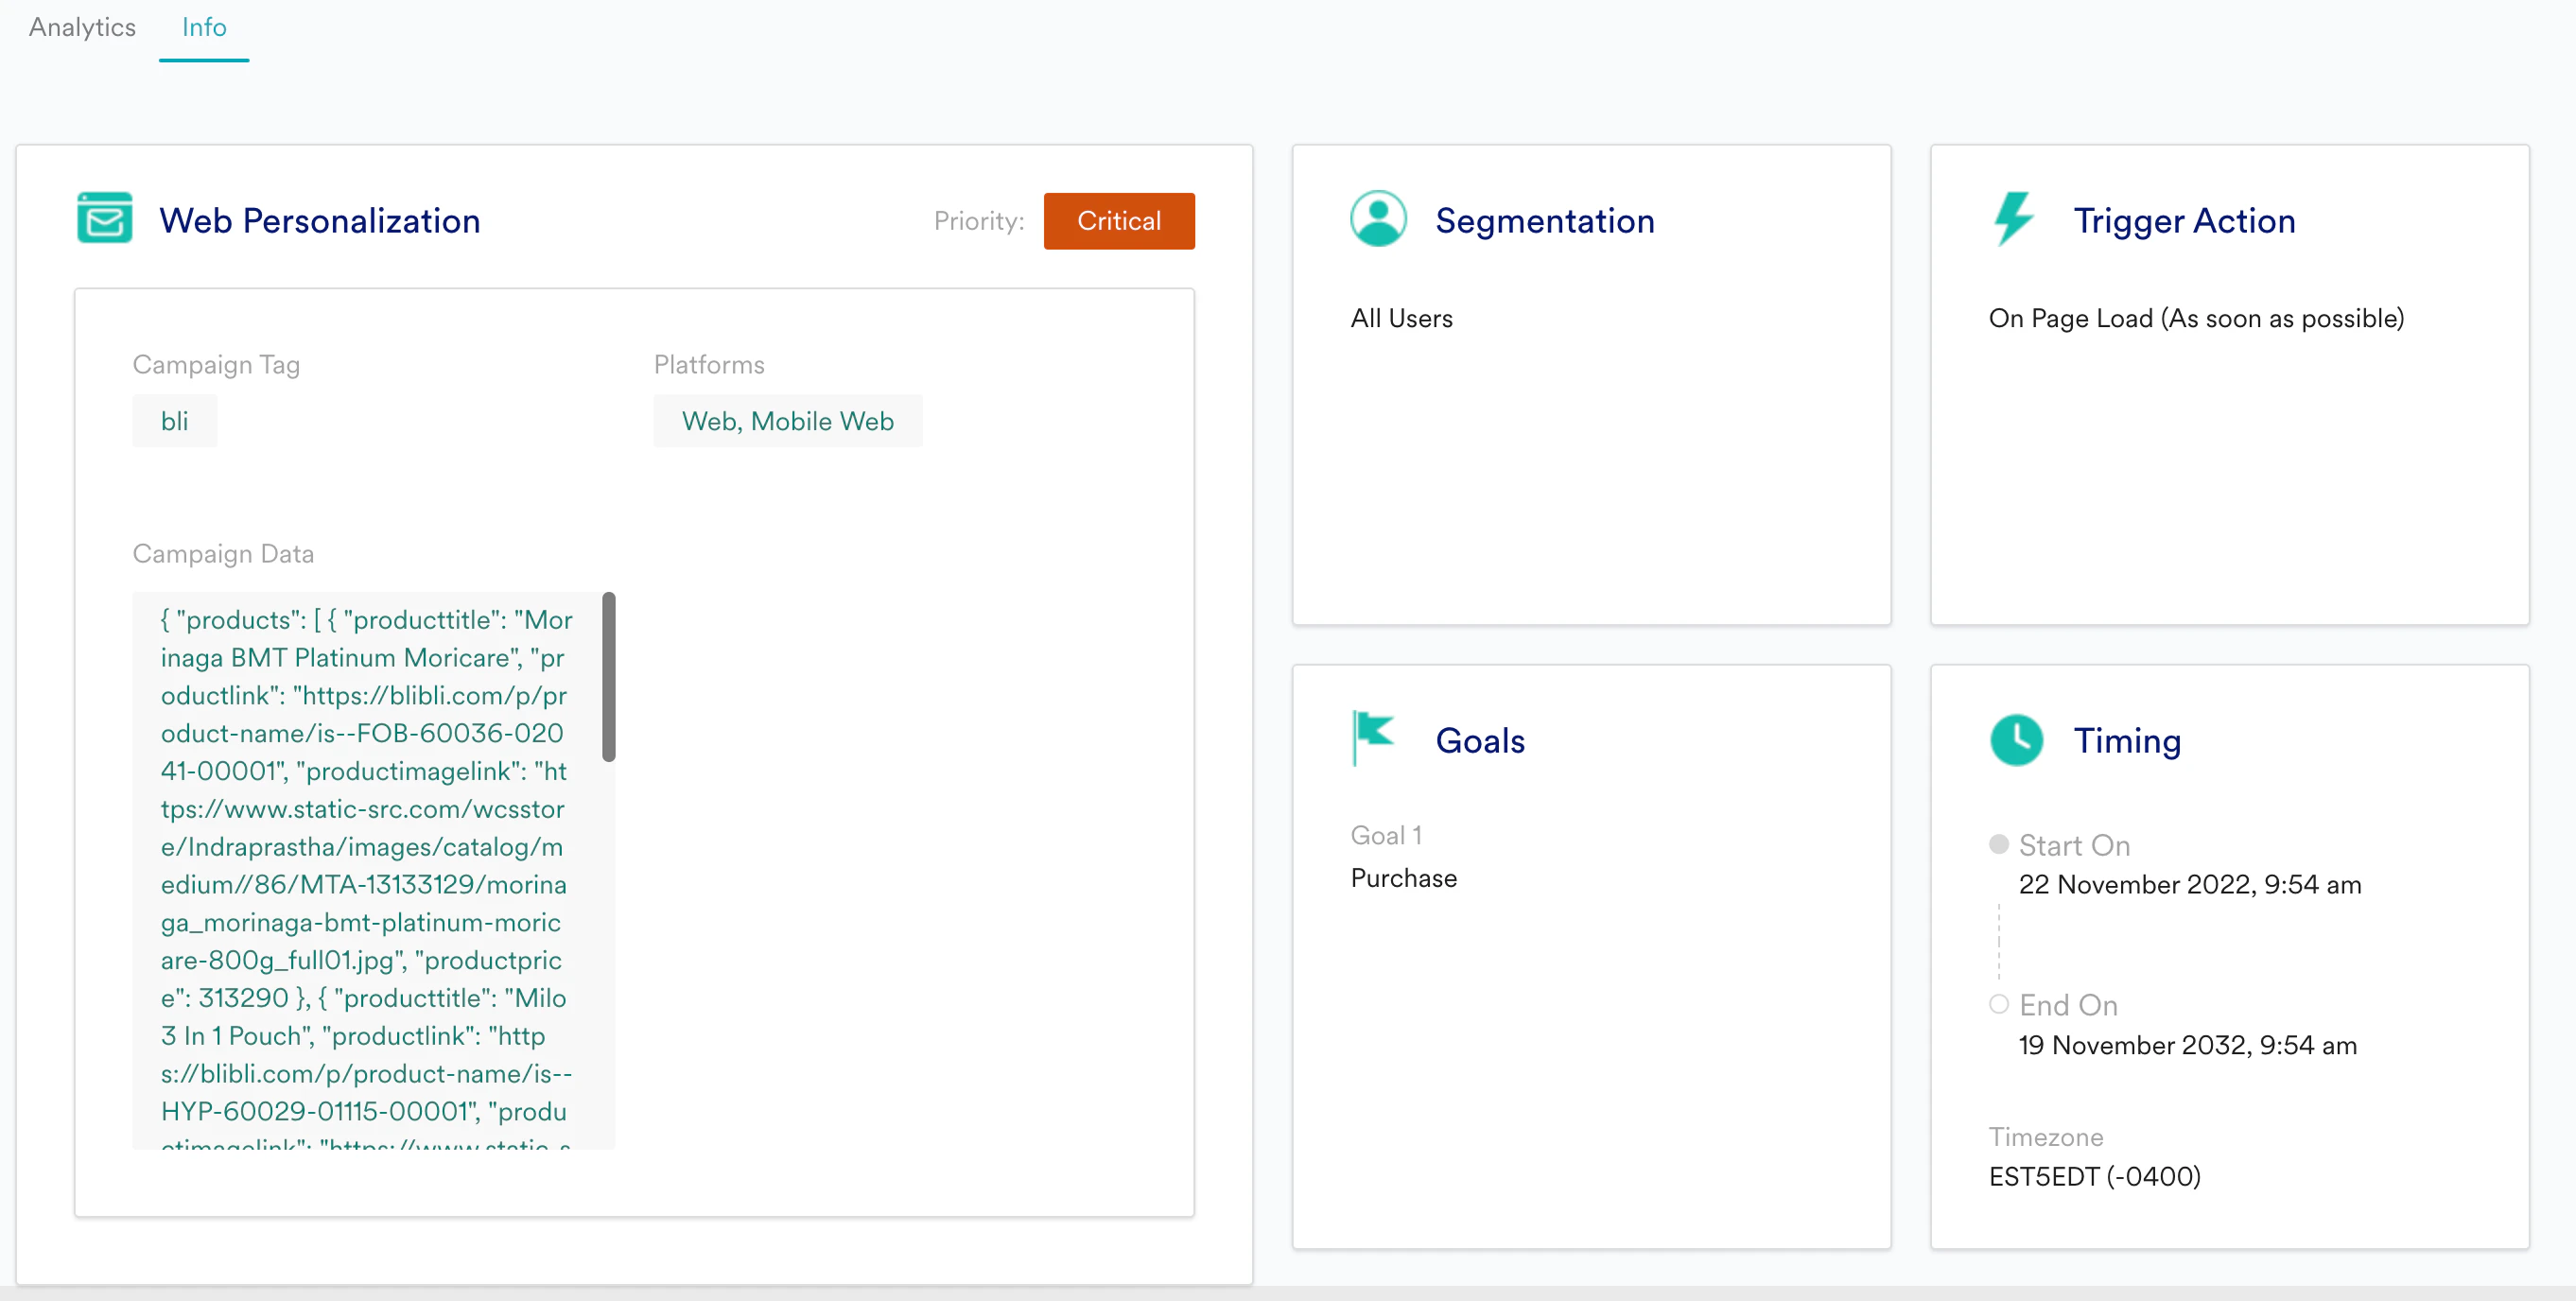
Analytics
The following metrics are displayed to show how the campaign has performed: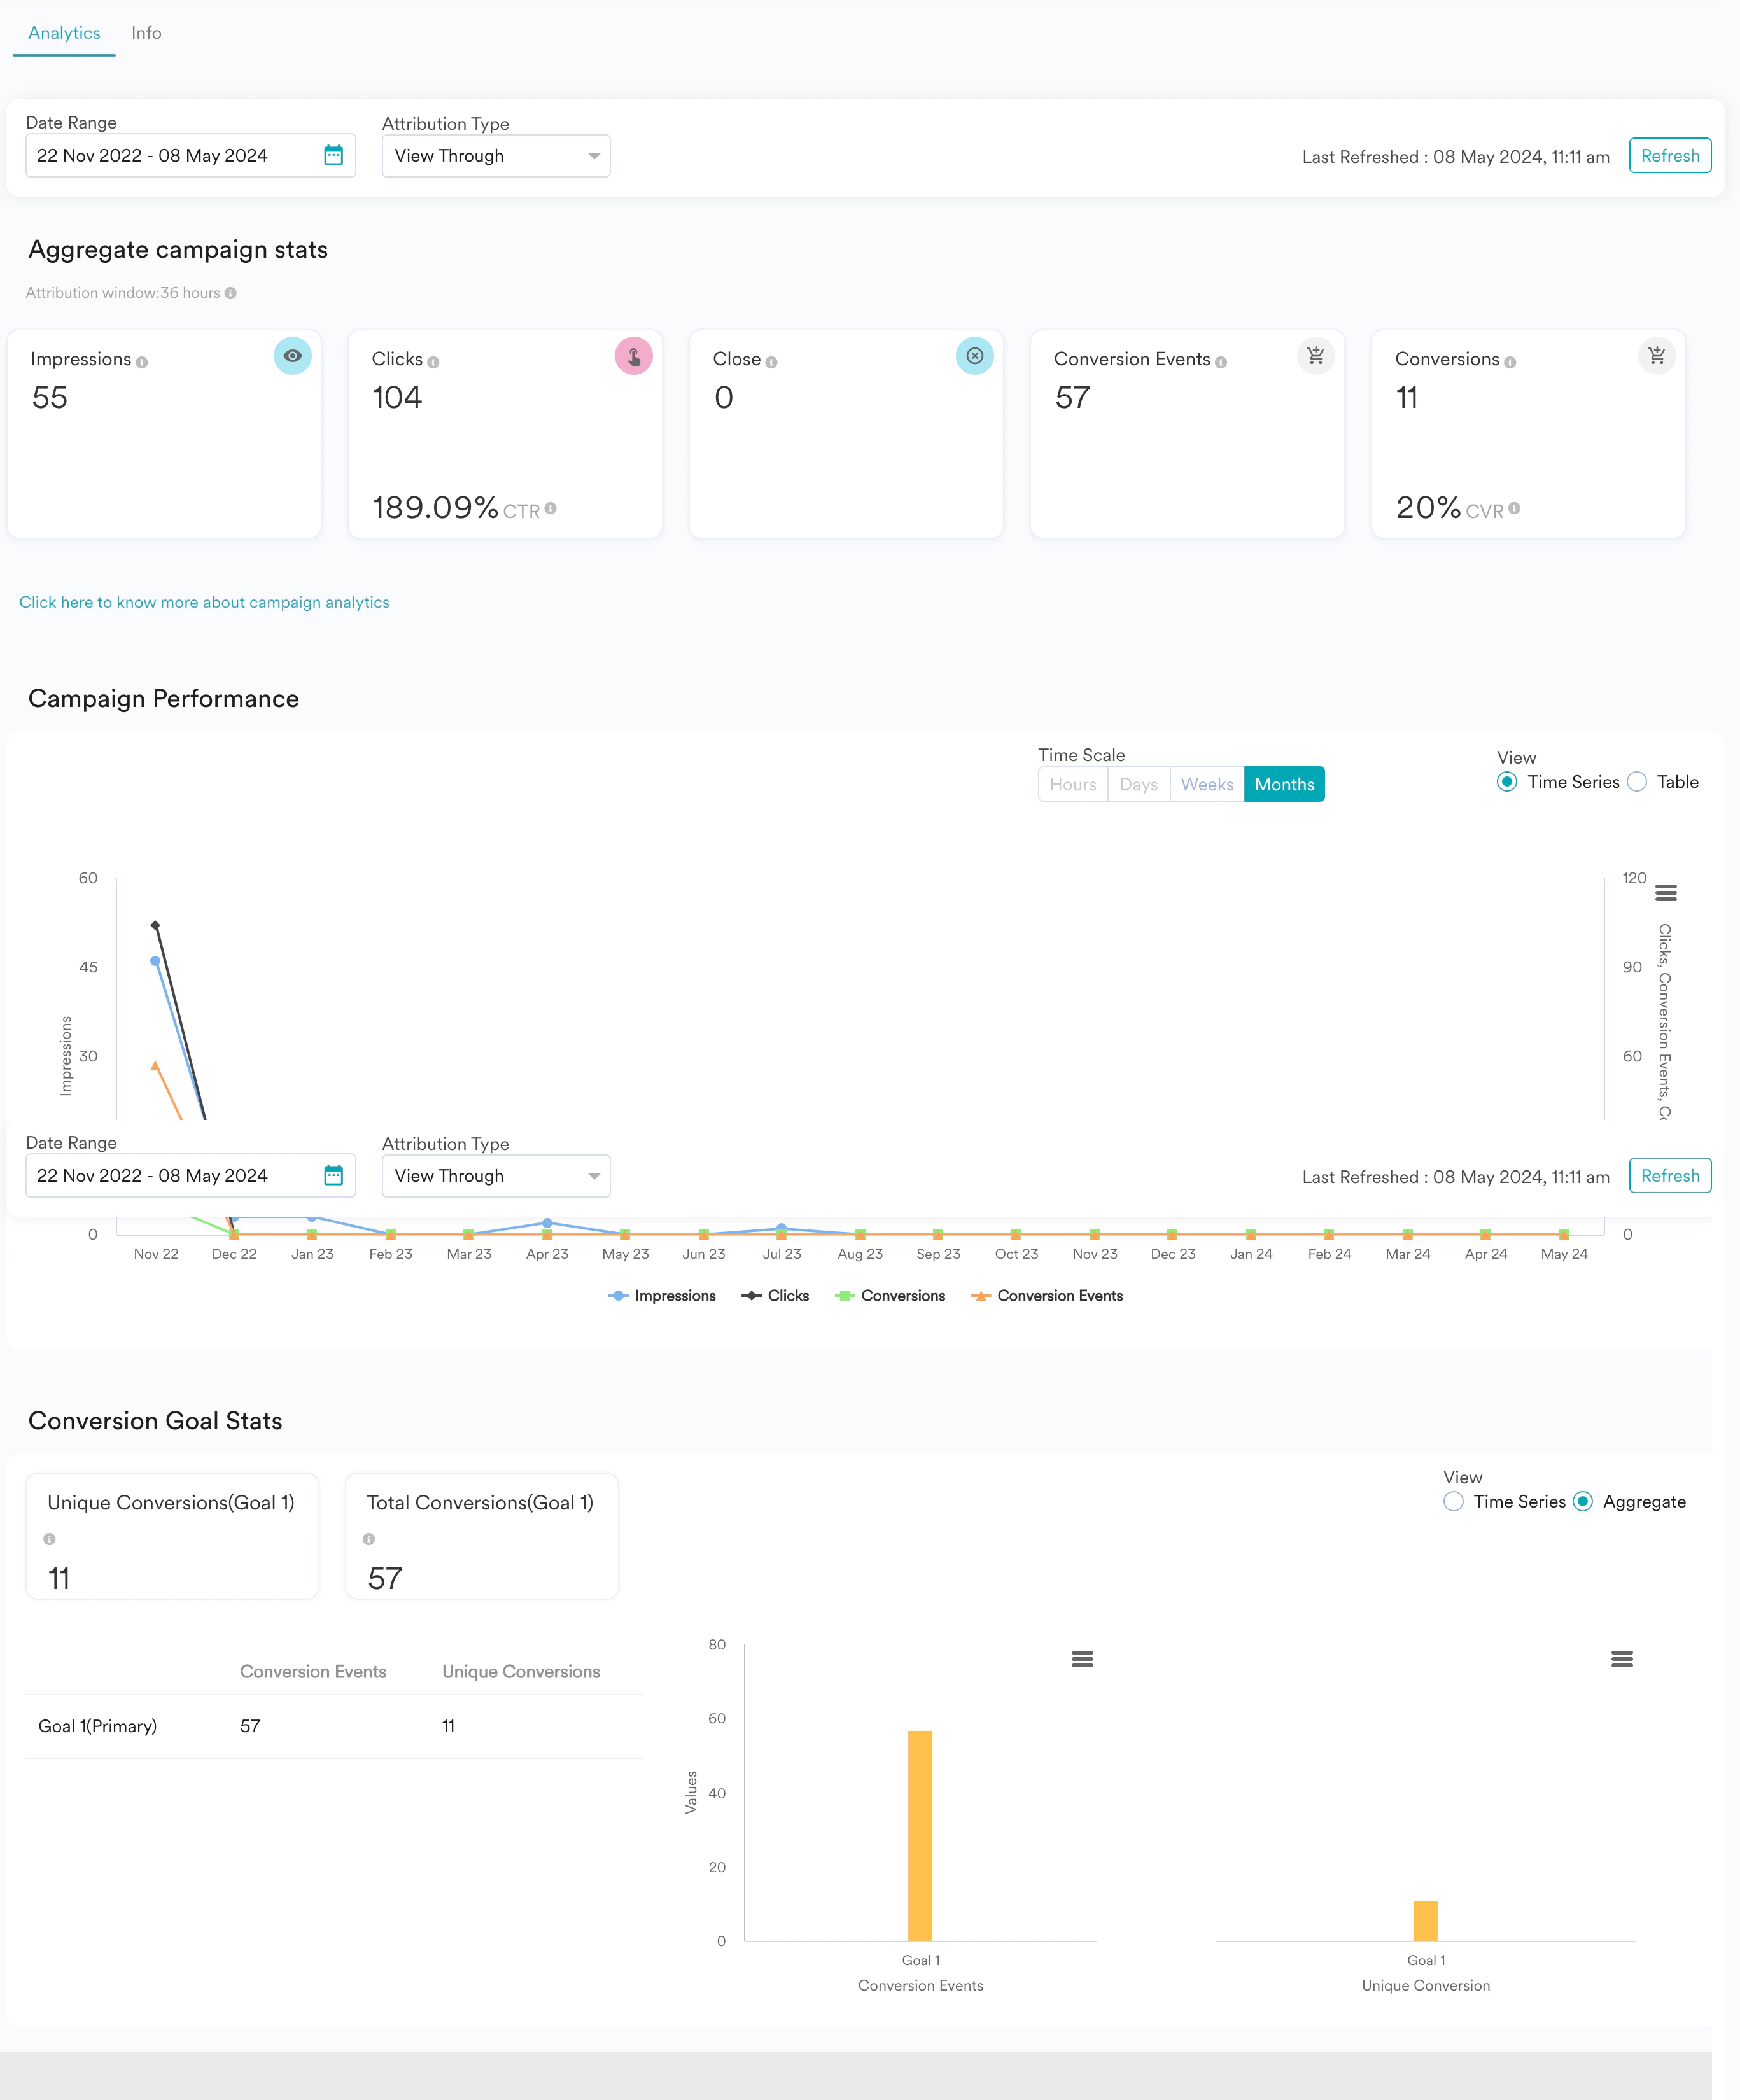
- Date Range - The period for which the campaign will be tracked.
- Attribution Type - Displays the campaign statistics based on the attribute selected from the dropdown. To attribute conversions to this campaign, MoEngage supports three different models as described below:
- View Through - Conversion event performed after viewing the message.
- Click Through - Conversion event performed after clicking the message.
- In Session - Conversion event performed within 30 minutes of viewing the message.
Aggregate Campaign Statistics
The aggregated campaign metrics for the selected date range, attribution type, and platform are described as follows: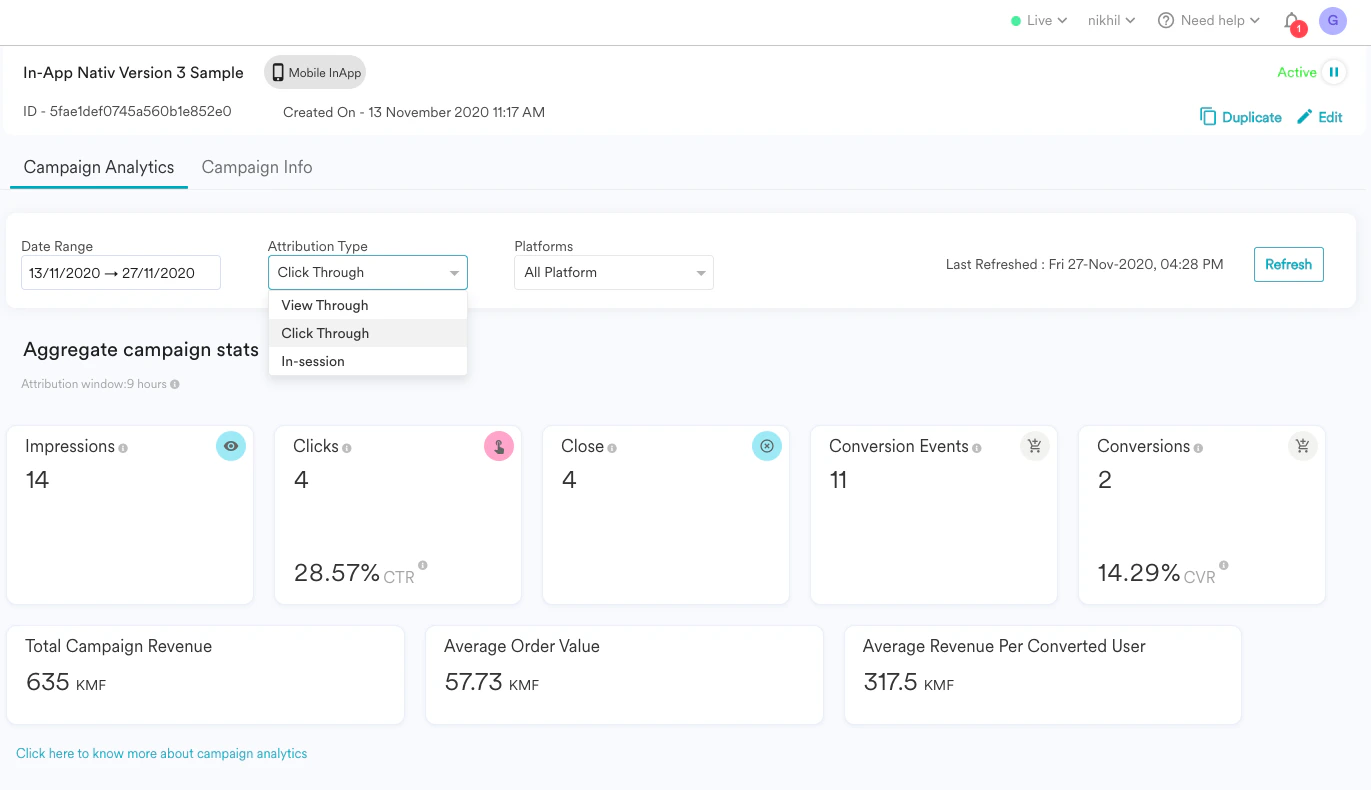
- Impressions - Number of times a message from this campaign was shown.
- Clicks - Number of times a message from this campaign was clicked.
- CTR - Click-through rate, calculated as CTR = Clicks / Impressions
- Close - Number of times a message from this campaign was closed.
- Conversion Events - Total Number of times the primary conversion goal was performed after an impression/click of this campaign’s message. The number will vary as per the attribution type selected.
- Conversions - Total Number of times the primary conversion goal was performed after an impression/click of this campaign’s message. The number will vary as per the attribution type selected.
- CVR - Conversion Rate, calculate as CVR = Conversions / Impressions.
Campaign Revenue
You can now define a revenue attribute along with your primary conversion goal while creating an on-site messaging campaign as shown below - Once defined, you will be able to see the below metrics on the campaign analytics page which will tell you the exact revenue that your campaign is driving.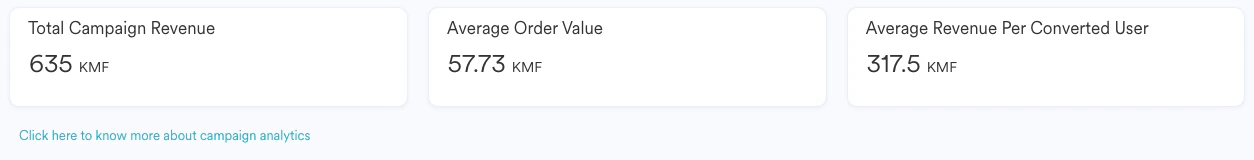
- Total Campaign Revenue - This represents the total revenue generated through this campaign.
- Average Order Value - Average order value represents the average value of conversions through this campaign. Average Order Value = Total Campaign Revenue / Total Conversion Events.
- Average Revenue Per Converted User - This represents the total revenue generated by each user who performed the conversion event. ARPCU = Total Campaign Revenue / Total Conversion
You need to set the revenue attribute in your Conversion Events to be able to see this revenue information in campaign analytics.
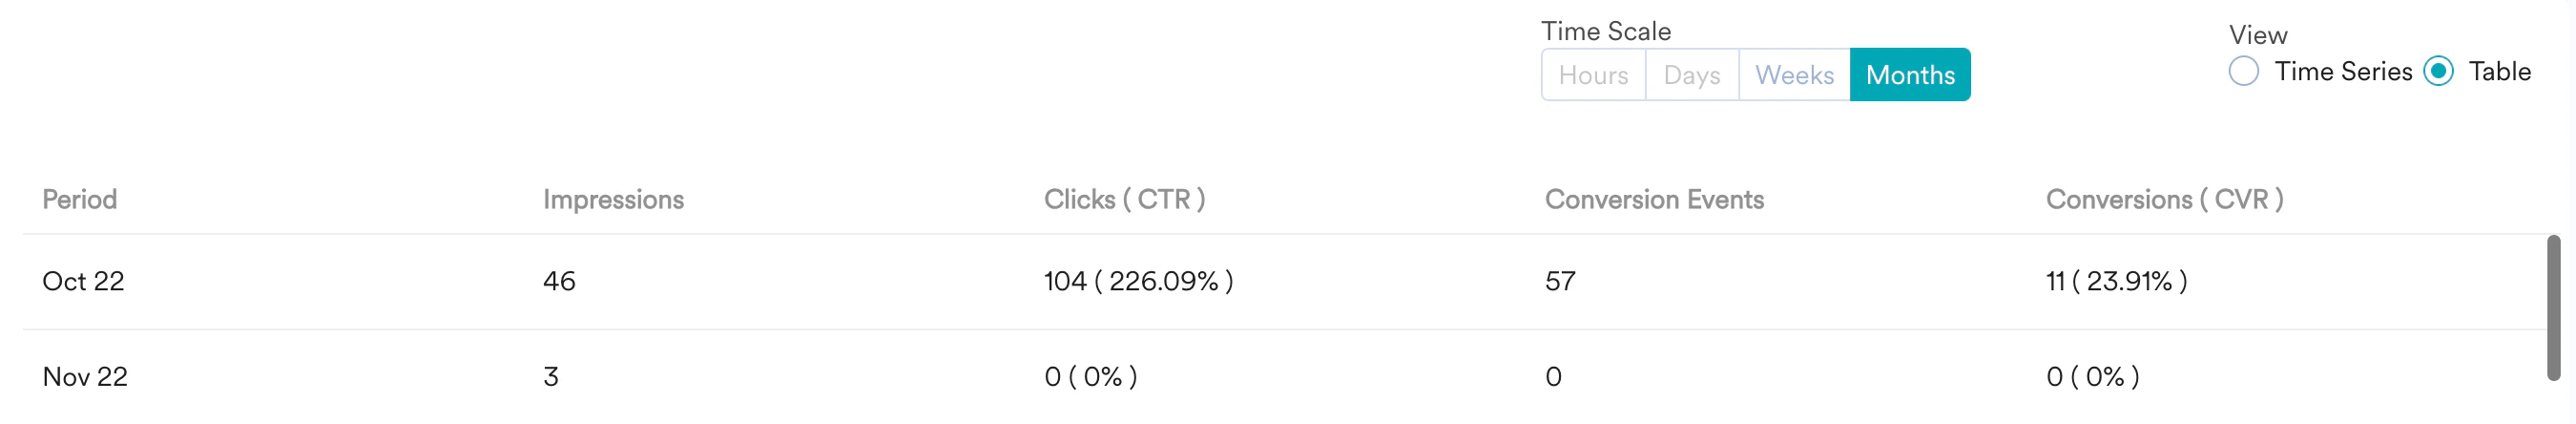
Campaign Performance
This section provides a graphical representation of the time series data of how the campaign metrics have varied in performance (Impressions, Clicks, Conversions, and Conversion Events) over a specific period.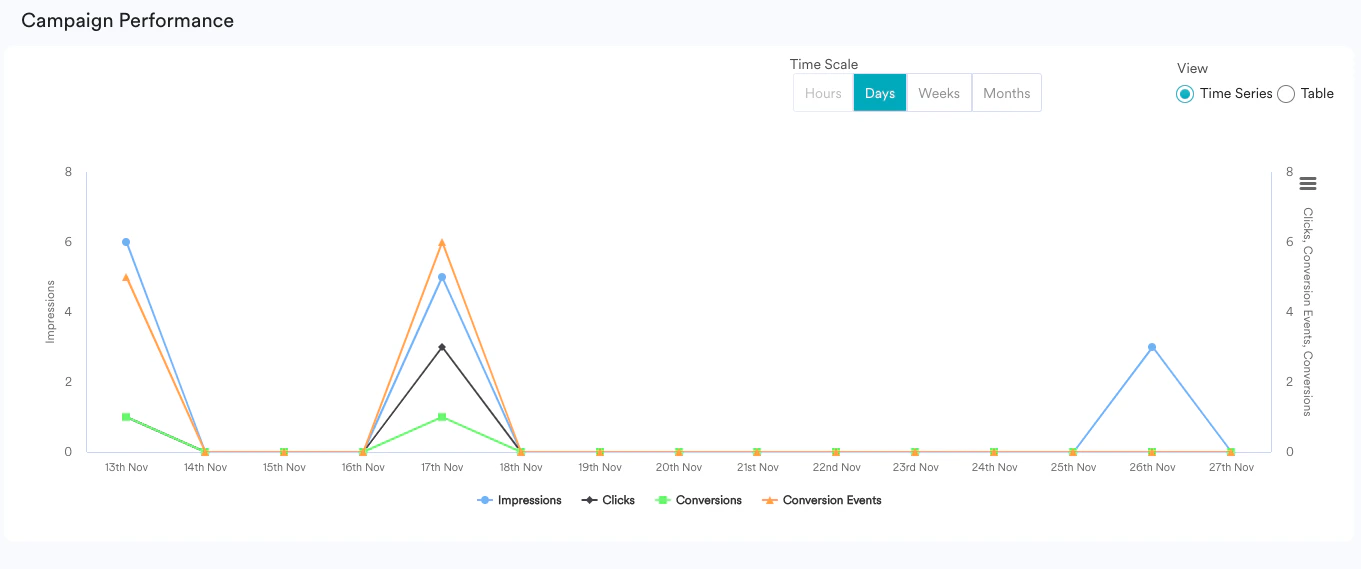
Conversion Goals Statistics
This section highlights the number of Total Conversions and Unique Conversions of the Primary conversion goal, as well as the performance of each conversion goal. In your Web Personalization campaigns, you can now add up to 5 conversion goals and view the performance of each conversion goal in this section.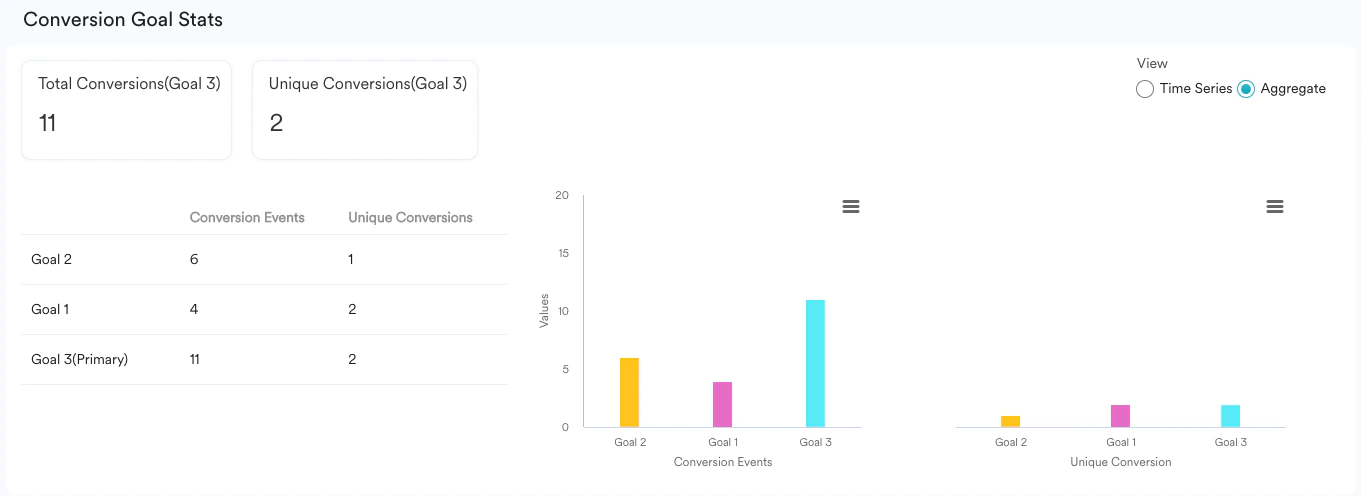
Info