

Overview
MoEngage Flows provides an intuitive way to analyze user interactions and understand the performance of the flow built. We represent the performance using Trips and a Trip basically represents a unique user journey, beginning with their entry into a flow after fulfilling certain conditions and including their interactions with campaigns and possible conversions along the way. The analytics of user trip data is crucial for effective user engagement and flow performance optimization. The explained metrics, including Active Trips, Engaged Trips, Converted Trips, Drop-offs, and Revenue among others, offer granular insights into user behaviour and interactions. You can also visualize and filter trip data using the Canvas and Detailed Stats views. Additionally, it sheds light on the performance analysis of individual channels and campaigns, helping you to fine-tune your customer engagement strategies.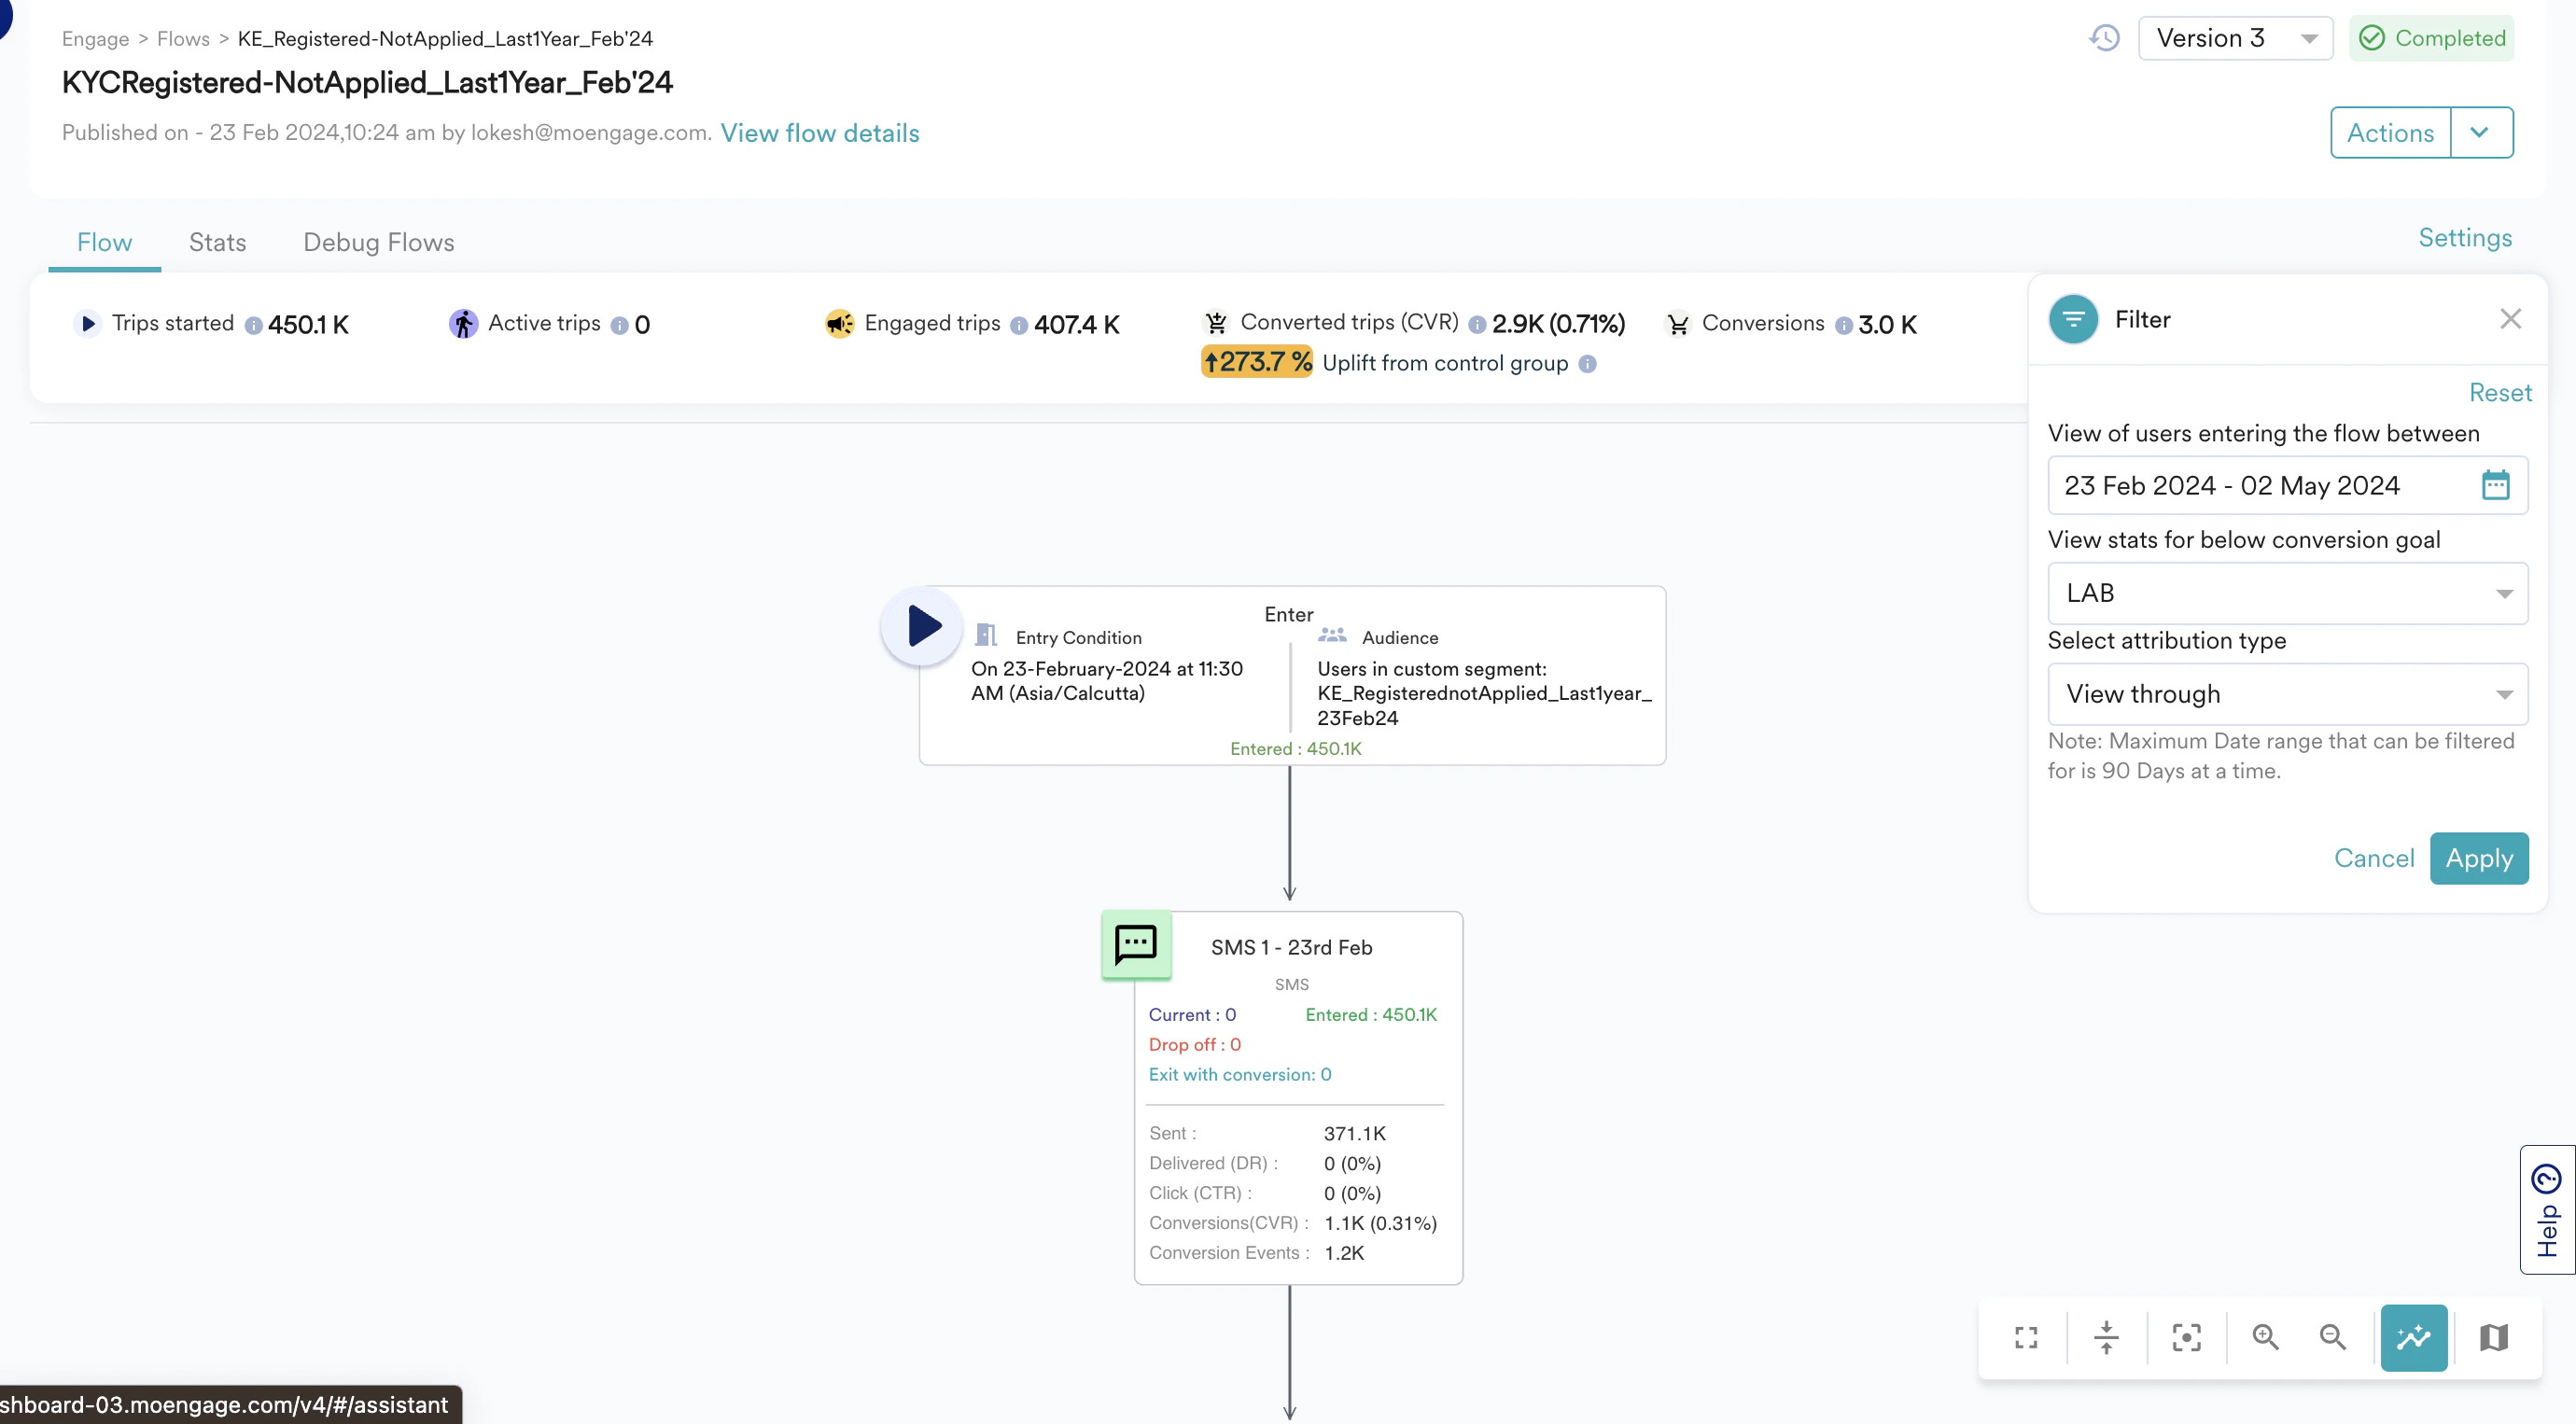
- This is an Early Access feature. To enable it for your account, please contact your MoEngage Customer Success Manager (CSM) or the Support team.
- All metrics are calculated and displayed in the App Timezone. To find your current app timezone value, refer to the Workspace Settings.
- This feature applies only to flows created after it is enabled; flows created prior to enablement will continue to show stats in GMT.
Why Trips?
While tracking the total user entries is an alternative, we identify that auxiliary metrics such as unique user entries and unique conversions are to be tracked and reported every time to remove the ambiguity among the metrics. As a Trip uniquely identifies each instance a user might enter a flow over the lifetime of a user, it provides an unambiguous concept that can be extended to every metric you would want to track to analyze the performance of your flow.Definition of Metrics
In every flow, you can see the following top-level metrics:Example
For a flow with action campaigns C1 and C2, User U1 enters the flow and receives both campaigns and converts with the configured conversion goal 2 times. Now, after the user exits the flow, the stats will be:- Total Trips: 1
- Active Trips: 0
- Engaged Trips: 1 (although the user received both campaigns, it will be treated as one trip)
- Converted Trips: 1
- Total Conversions:2
- Total Trips: 2
- Active Trips: 0
- Engaged Trips: 1
- Converted Trips: 1
- Total Conversions:2
Canvas View
In addition to the overall stats at the top, you can also see the performance of each stage configured in the flow. By filtering for a defined time period, you can understand the behavior or stats of users who have entered the flow within that time.Entered = Current + Drop off + Exits for any given stage.
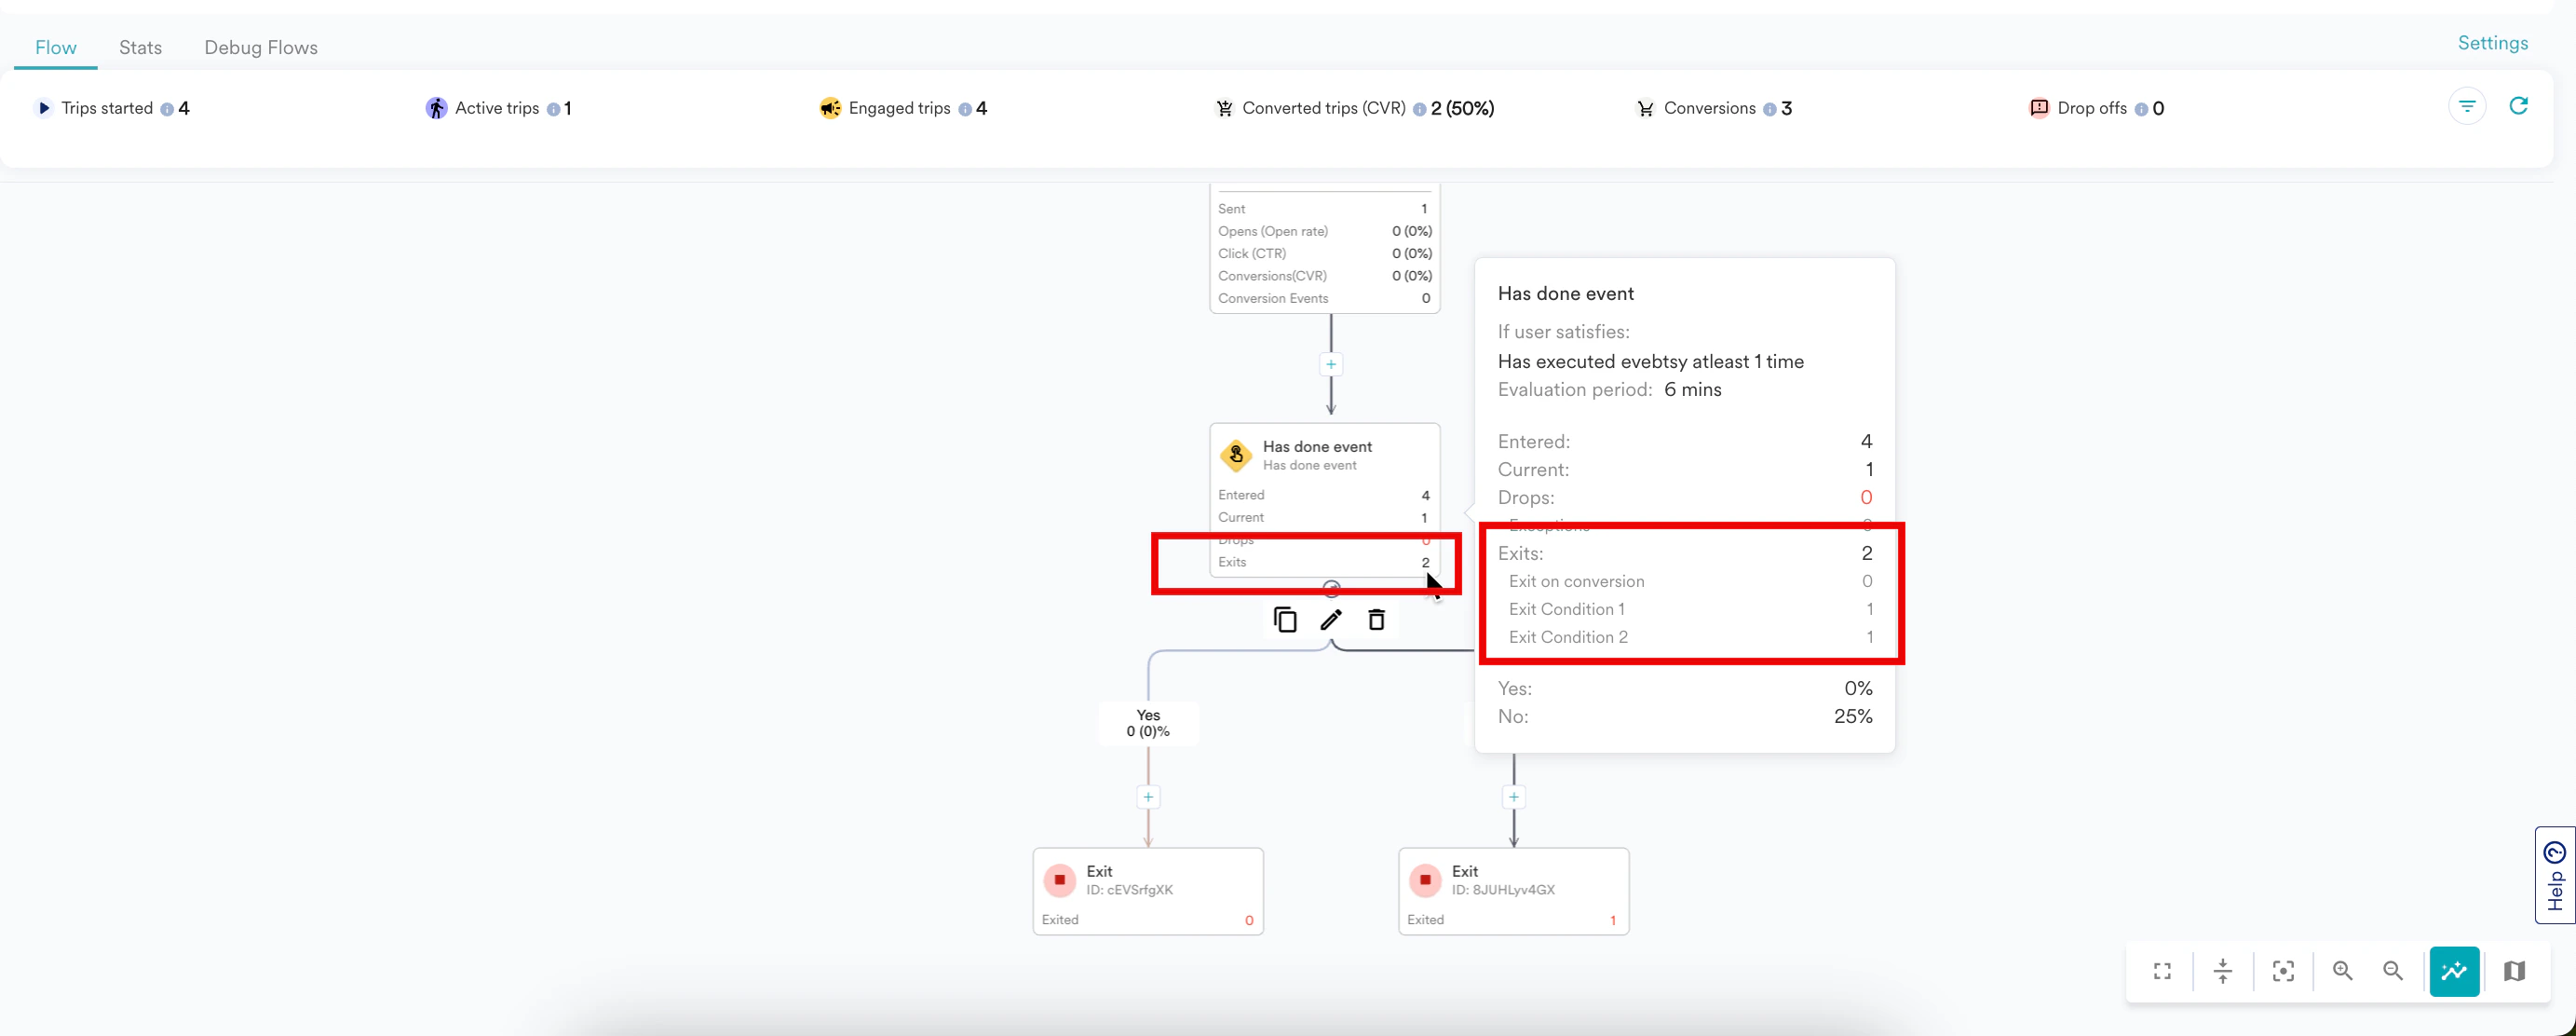
Users can exit from any stage in the flow due to reasons such as:
- Passing through an exit stage in the flow path
- Fulfilling the conditions in the exit criteria (for more information on adding exit criteria, refer to Global Exit Criteria)
- Achieving the conversion goal defined in the flow
- Dropping off due to reasons mentioned in the Definition of Metrics section.
In canvas view, when you filter for a time period, it shows data for all users who have entered the flow in the specified time period. The detailed stats show data of what has happened during that time period regardless of when the user entered the flow. For more information, refer here.
Conversion Uplift
Uplift is only shown in overall stats if the control group was enabled for at least a day during the filtered period. To know more about how uplift is calculated, click here.Legends
The colors in the canvas represent the flow path and the decisions made to send campaigns to your customers. The following table describes the legends on the canvas:| Legend | Description |
|---|---|
| Black Line | Displays the next step when the Yes condition is fulfilled for an event or campaign. |
| Grey Line | Displays the next step when the No condition is fulfilled for an event or campaign. |
 | Displays the start or entry of the flow. |
 | Displays the stop or exit points of the flow. |
 | Displays the Has Done Event in the flow. |
 | Displays the Check User Attributes in the flow. |
 | Displays the conditional split. For more information, refer to Conditions in flows. |
 | Displays the Email campaigns of the flow. |
 | Displays the Push campaigns of the flow. |
 | Displays the SMS campaigns of the flow. |
 | Displays the Connector campaigns of the flow. |
 | Displays the Facebook campaigns of the flow. |
 | Displays the In-App campaigns of the flow. |
 | Displays the On-site campaigns of the flow. |
 | Displays the WhatsApp campaigns of the flow. |
 | Displays the Cards campaigns of the flow. |
 | Displays the Google Ads Audience campaigns of the flow. |
 | Displays the Next Best Action campaigns of the flow. |
 | Displays the intelligence path optimizer used in the flow. |
 | Displays the A/B split used in the flow. |
 | Displays the Wait Till used in the flow. |
 | Displays the GoTo used in the flow. |
Detailed Stats
You can open the detailed stats page for your flow by clicking the “Stats” tab adjacent to the “Flows” tab.The detailed stats are shown for the last 90 days by default or since the current version’s published time, whichever is shorter. You can see the stats from the time the flow was published using the date range filter.
Flow Performance
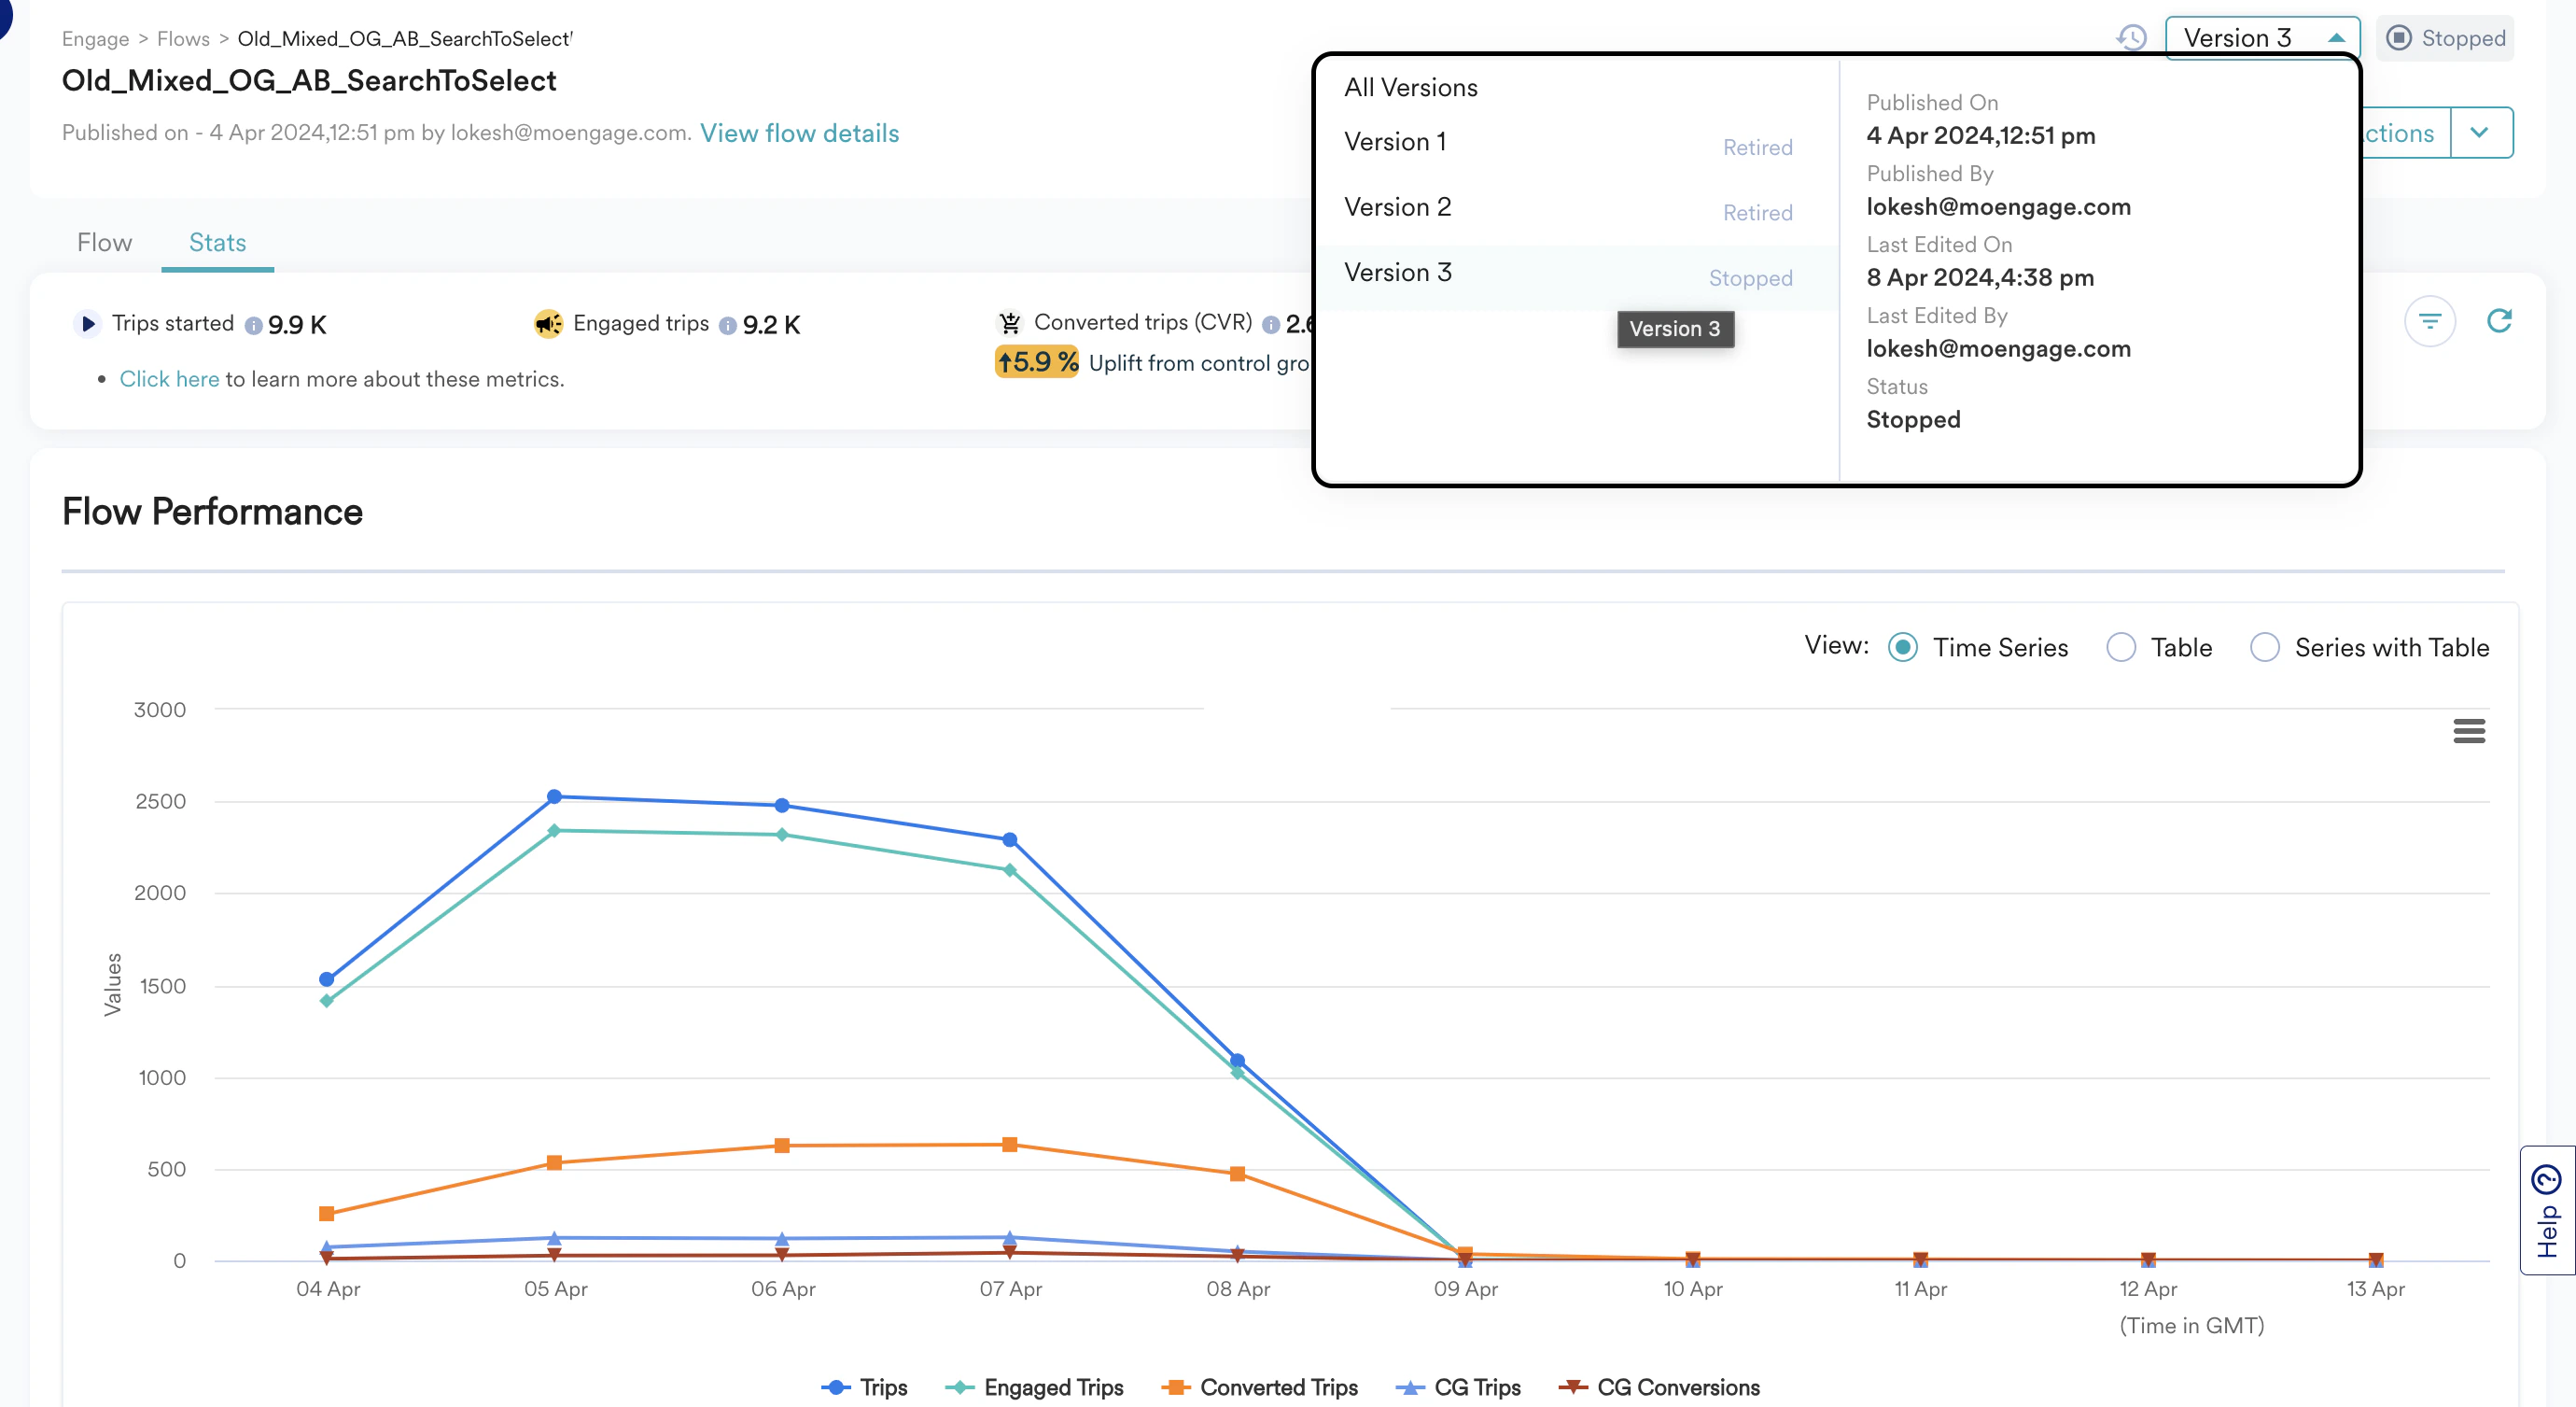
The stats of the currently active version of the Flow are loaded in this section. You can see the stats of any specific version by selecting the version from the version selector as shown in the following image. You can choose the following in the version selector:- Specific Version: This section shows you the trends of User trips, Engaged Trips, and Converted trips over time for the selected Version. If the control group is enabled during the filtered time, the conversion uplift is also shown.
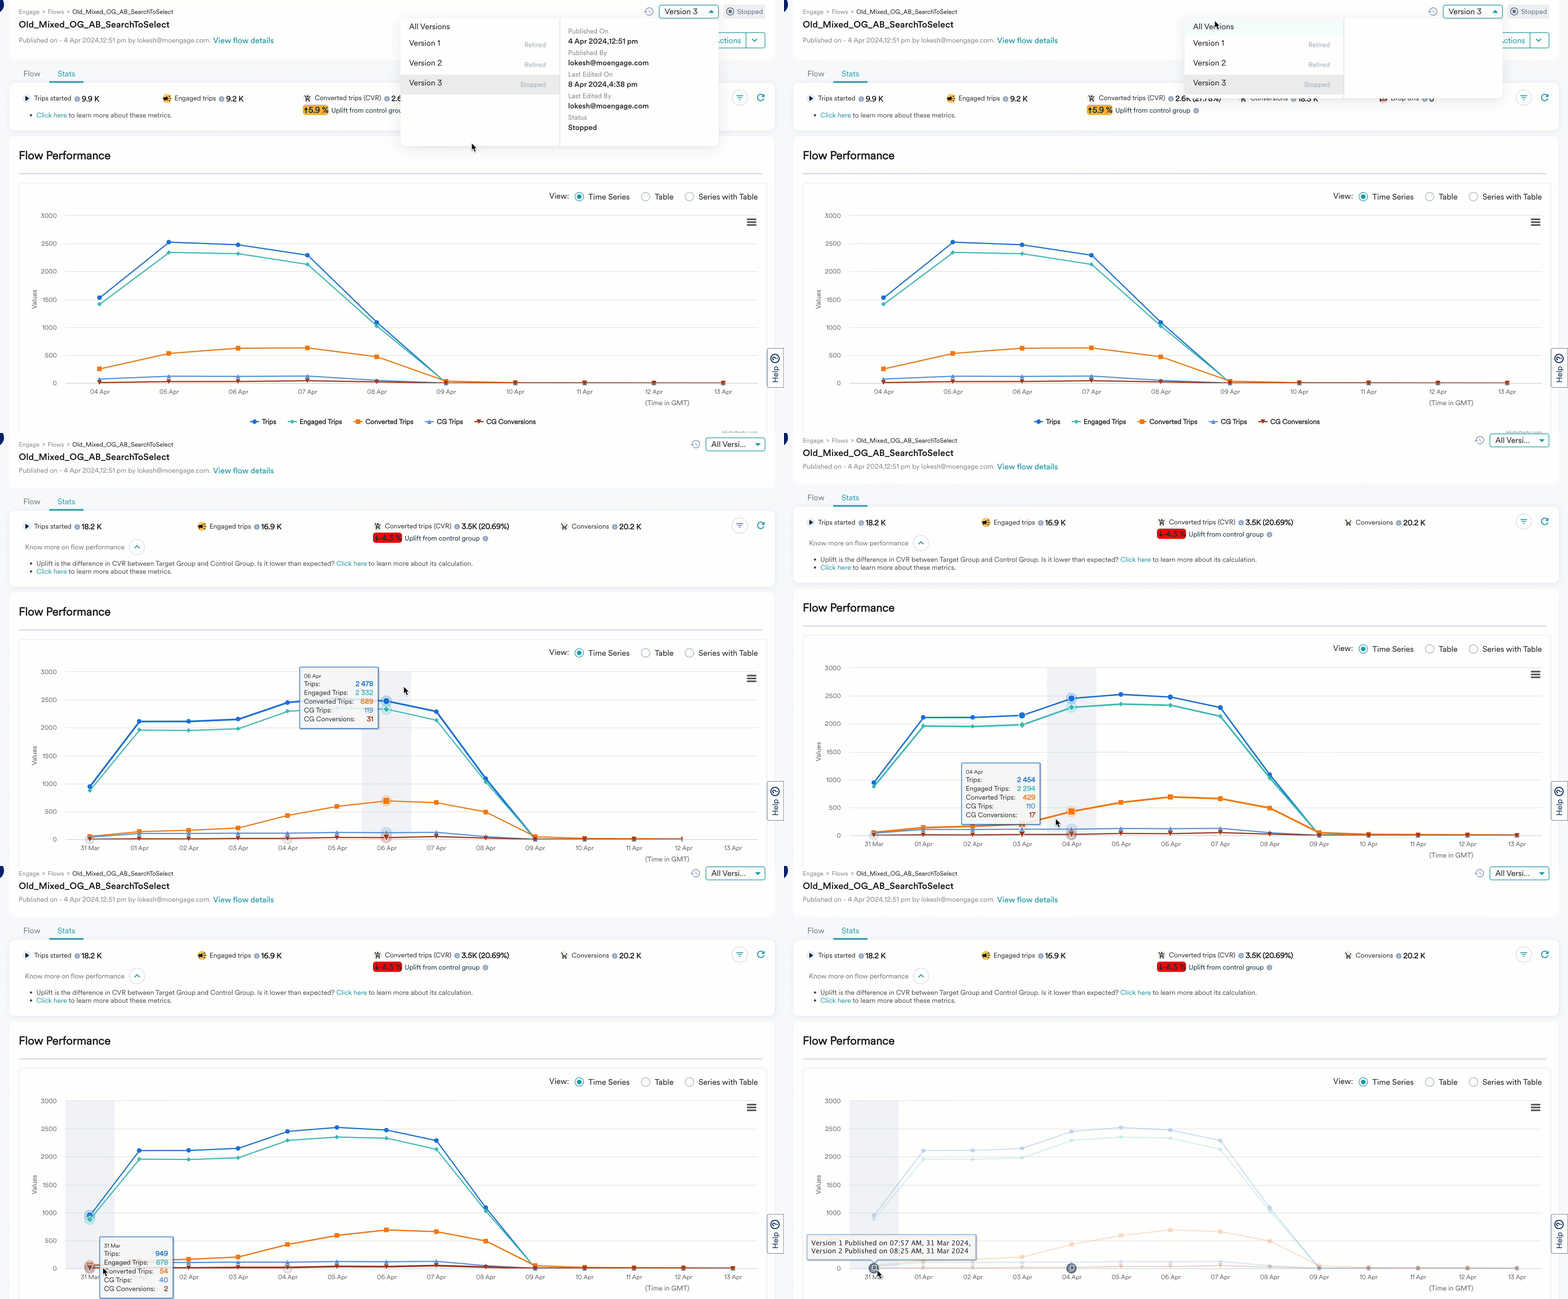
- All Versions: The _All Versions_option loads the cumulative stats for all versions put together. The Flow Performance for All Versions has information about User Trips, Engaged Trips, and Converted Trips and Conversions over time. If the control group is enabled during the filtered time, the conversion uplift is also shown. Revenue performance is not available in the All Versions option, because each version might have a different revenue attribute or currency. The chart also shows when each version was published.
- For a particular time period based on the dates.
- Based on the conversion goals.
Are your control group trips more than the defined percentage, or is there a negative uplift? Refer to the uplift calculation and CG Allotment for more information.
Drop-Offs and Exits
This section has the following tabs:- Drops - This tab lists reasons for all drop-offs, an explanation for each drop-off reason, the total drop-offs due to this reason, and the percentage of all drop-offs. When you expand a drop-off reason, you will see the stage type and stage name from which users were dropped off.

- Exits - This tab lists reasons for all exits, an explanation for each exit reason, the total exits due to this reason, and the percentage of all exits. When you expand an exit reason, you will see the stage type and stage name from which users exited.
This tab also shows Exit on conversion. You can see stats of users who exited the flow on achieving the conversion goal defined in the flow.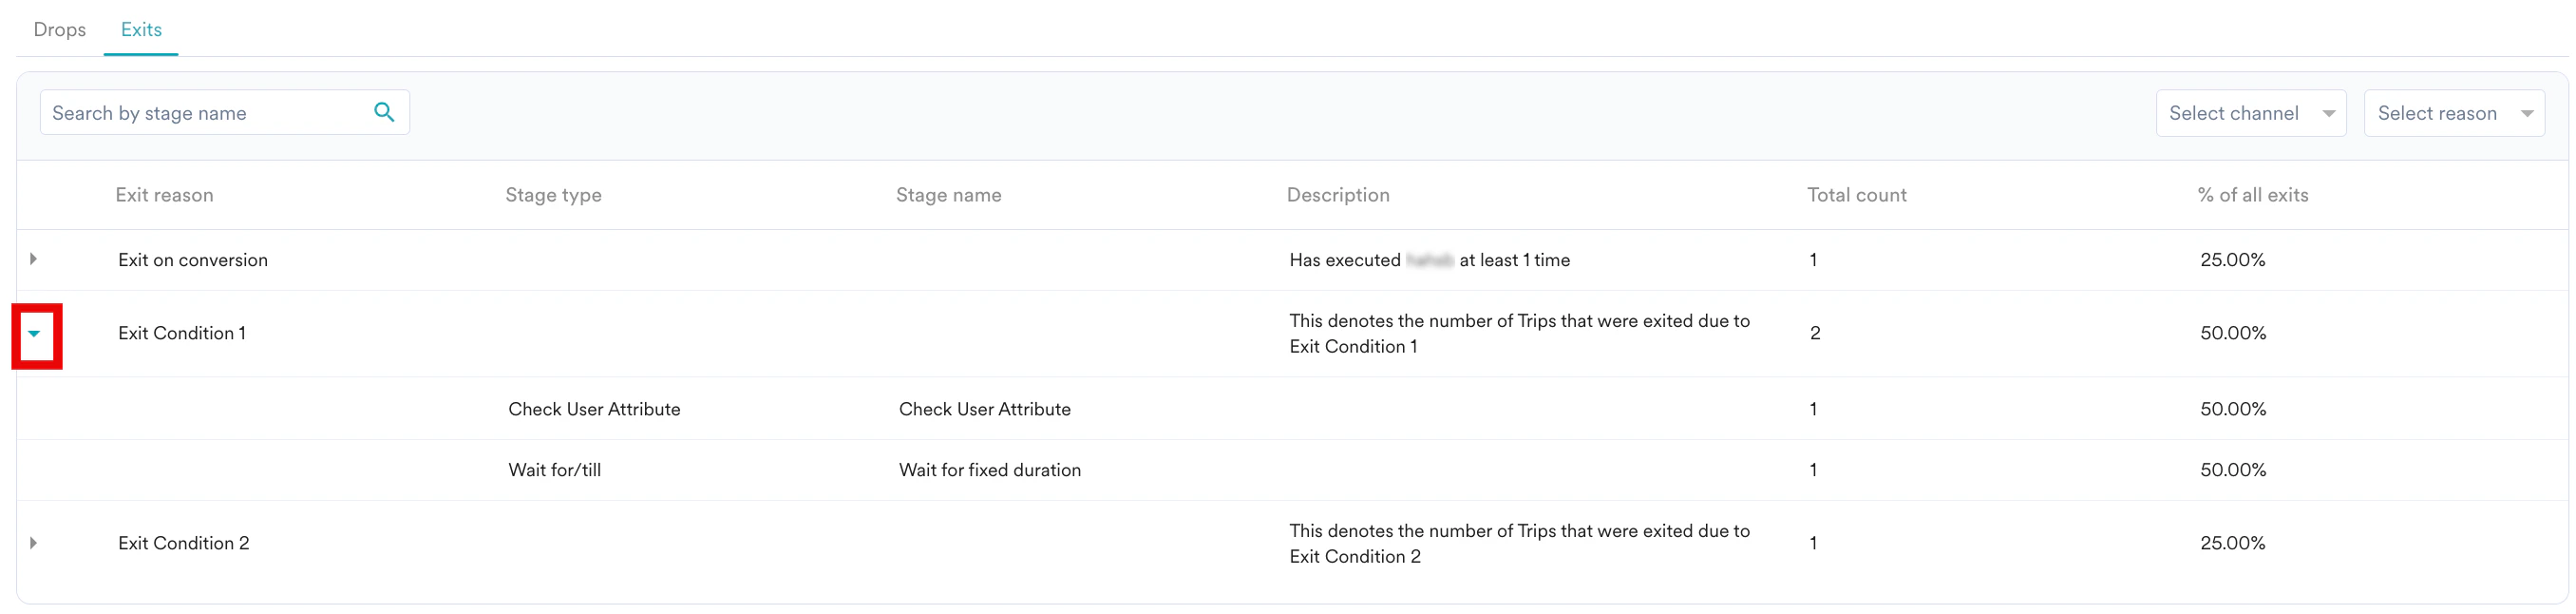
Business Events
This section helps you analyze the flow performance for each Business Event instance. When you expand the Business Event, you can see the impact of each instance separately on a day level. For more information, refer to the Definition of Metrics.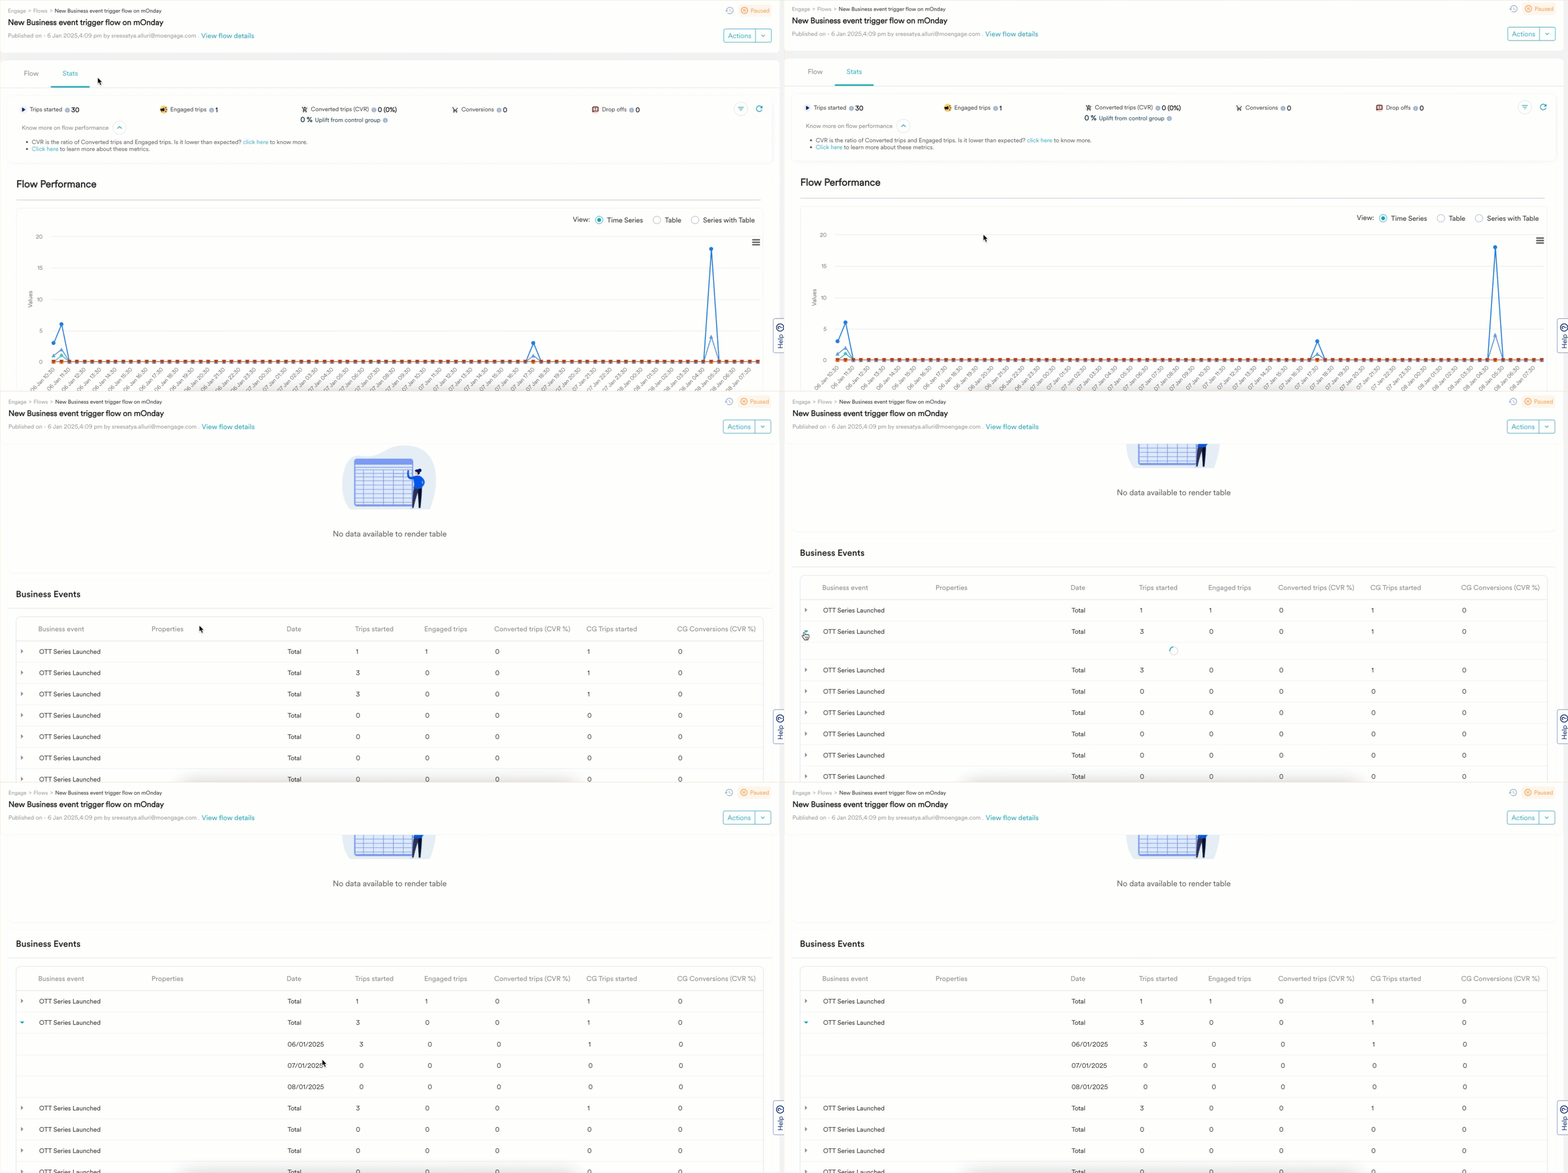
Engagement Trends
This section helps you to analyze the aggregate channel performances of all channels that are used in the flow. You can select the channel you want to analyze from the list of channels from the drop-down list. The four major aggregated metrics of the overall channel performance can be directly compared with the overall flow stats, as in the following image: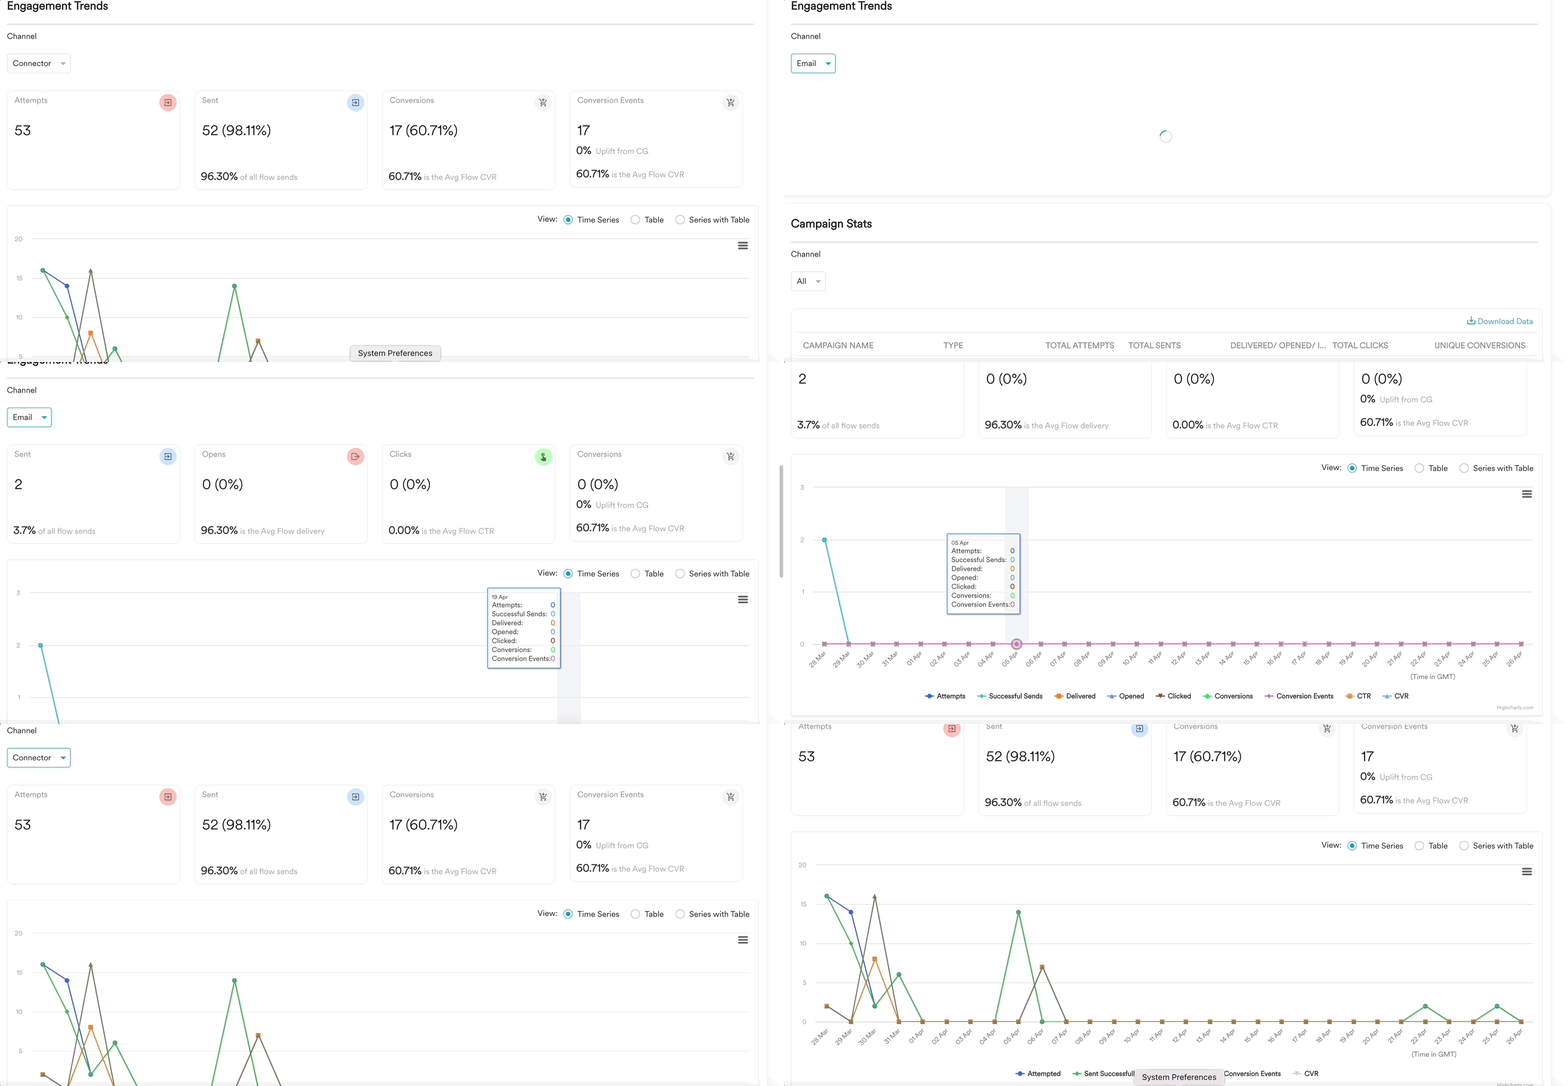
- Push
- Email
- SMS
- Connector
- OSM and In-App
- WhatsApp
- Facebook Audience
- Cards
- Google Ads
Campaign Stats
This section lists the performance of all action campaigns configured in the flow. This can help you compare the individual campaigns across channels. If required, you can choose to filter the action campaigns of one particular channel to understand and compare the performance of similar campaigns.You cannot add the metrics in each row of the Campaign Stats table and compare it with flow-level metrics because this table shows each campaign’s performance and thus will have overlapped attribution across campaigns. For example, the sum of unique conversions can be different from converted trips and conversions at the overall flow level. For more information, refer here.
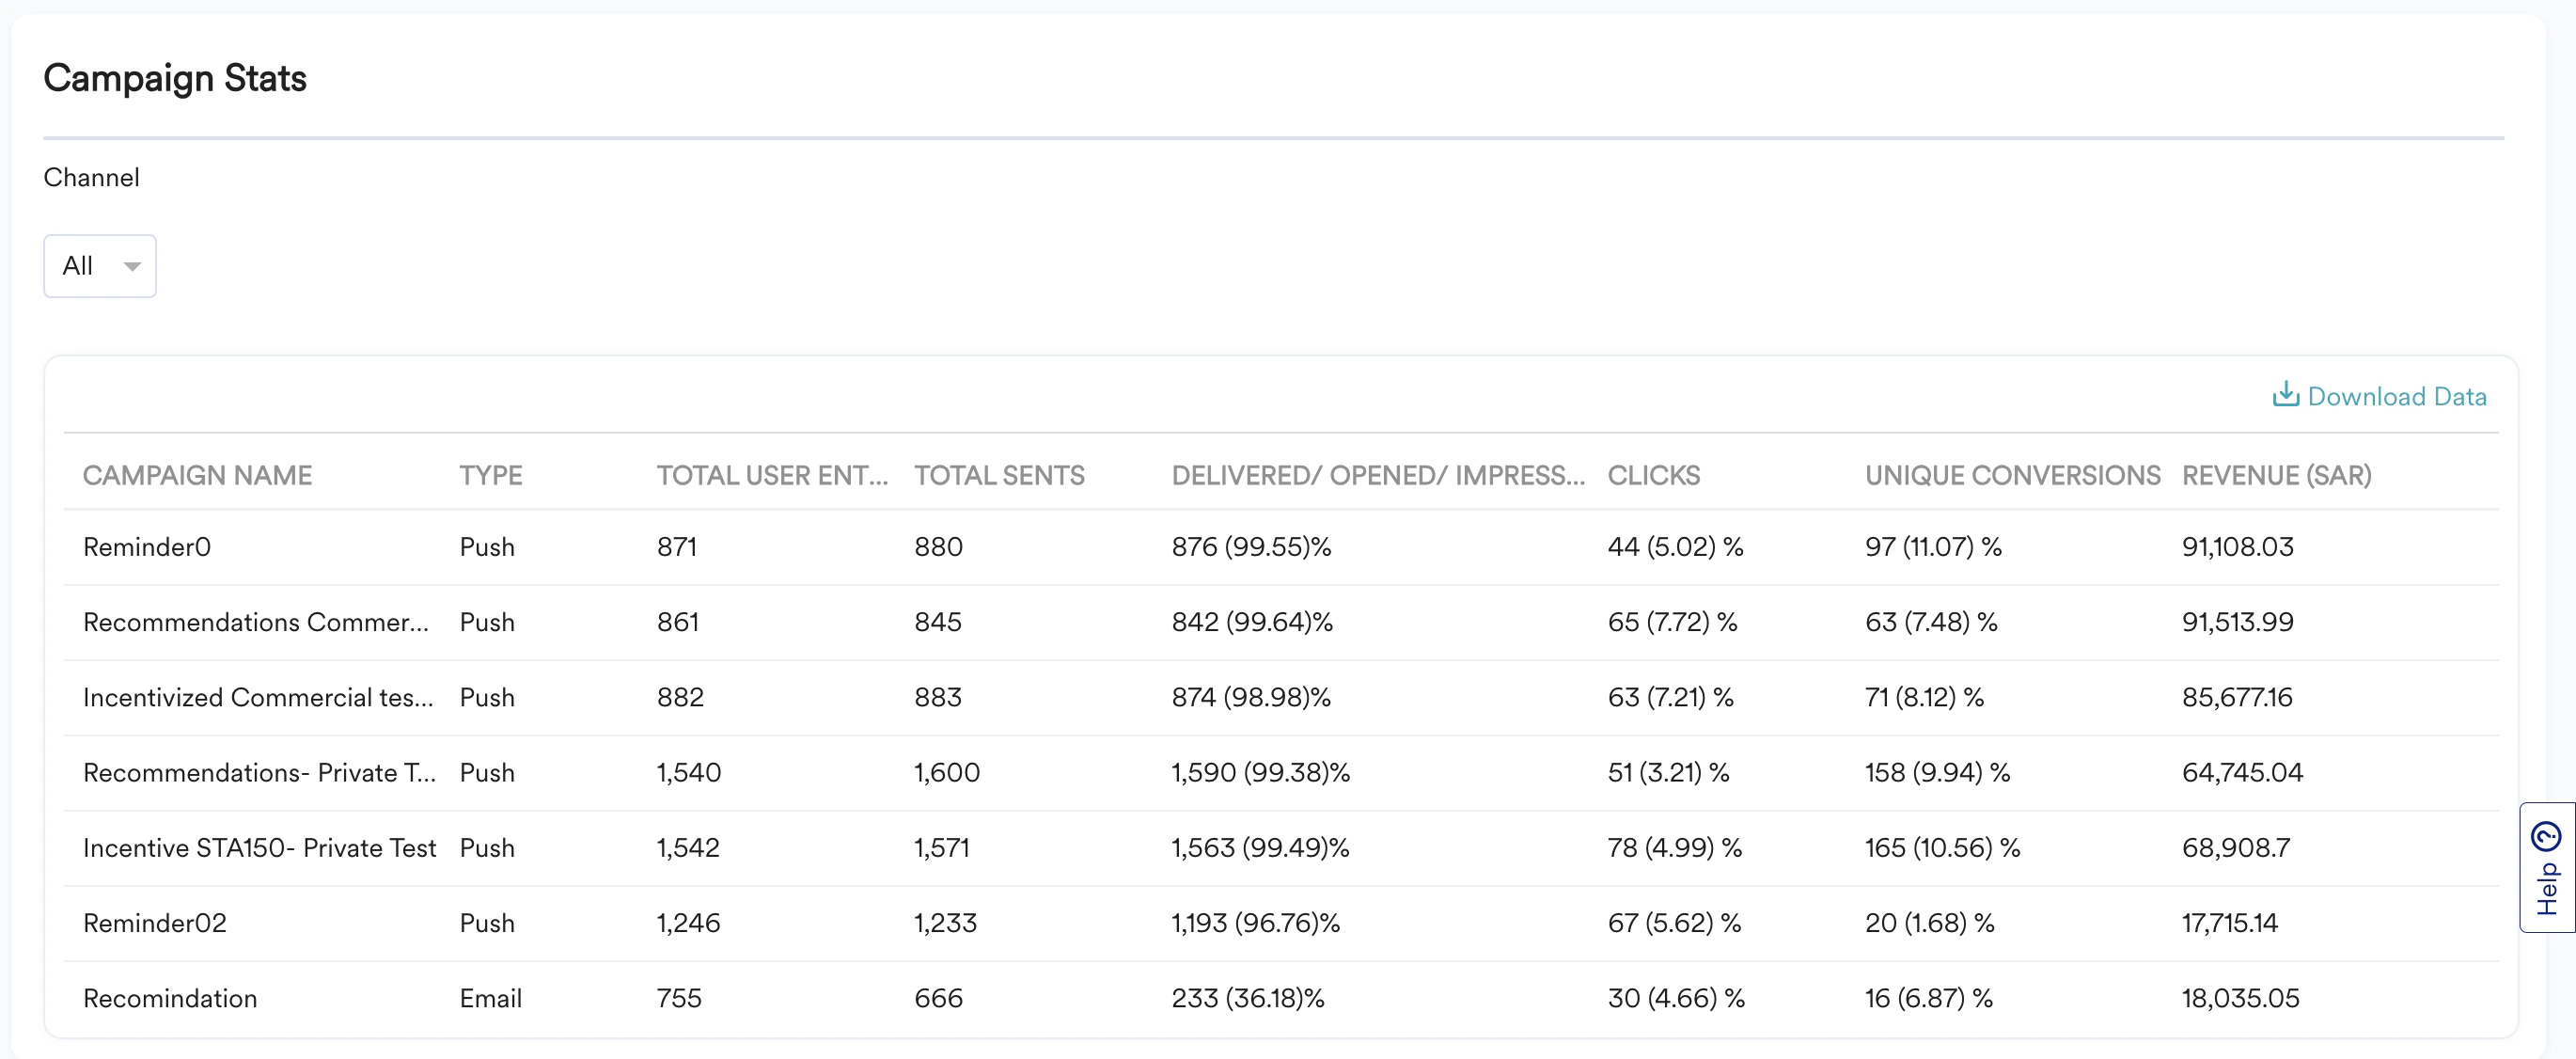
The current flow version’s Engagement Trends and Campaign Stats are shown by default. Use the version selector to view the trends and stats for other versions of the flow.